Imported an NMEA log into ArcGIS Earth? Awesome! Now, transform it into a powerful visual story by customizing its appearance for clearer analysis and compelling presentations.
🗺️ Control Your View:
- Right-click the NMEA layer in the Table of Contents and select “Display.”
- Choose to show Points, Polyline, or Both to focus on key aspects of your track.
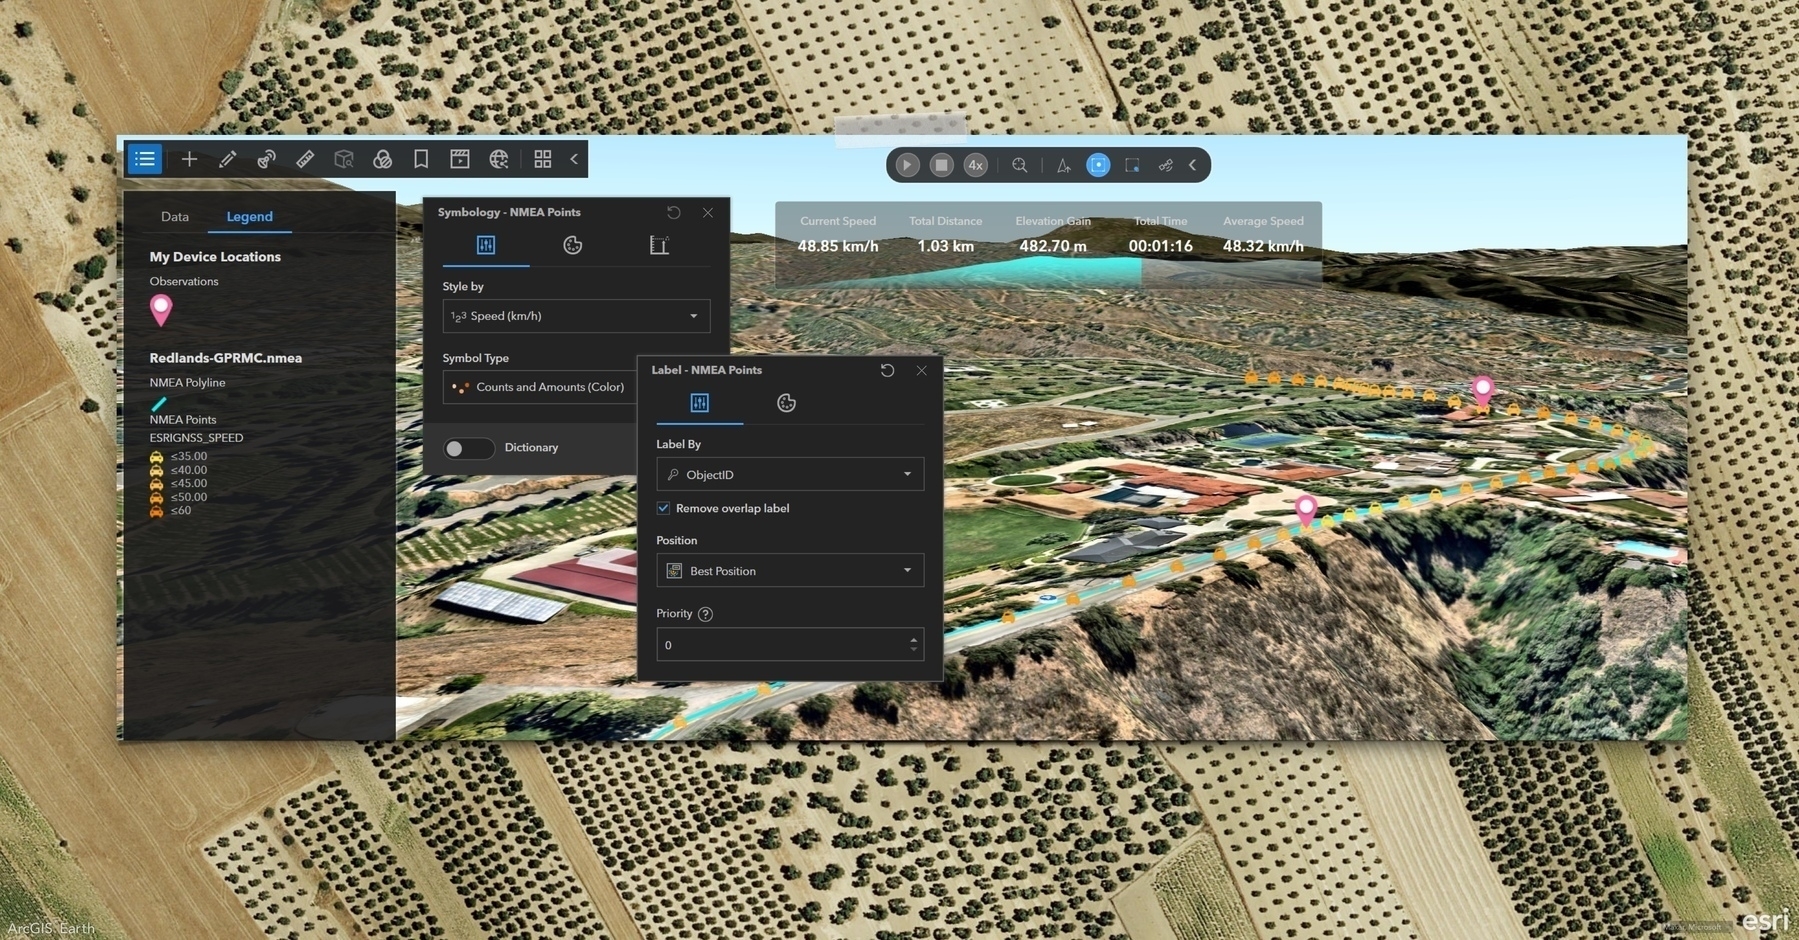
🎨 Style for Insight:
- Treat your NMEA layer like any feature layer – unleash the power of symbology!
- Apply color ramps to highlight speed, accuracy, or elevation variations.
- Adjust size and style for optimal visibility in immersive 3D scenes.
🏷️ Label for Context:
- Bring your data to life by labeling attributes like timestamp, speed, or elevation.
- Enhance analysis and presentations with crucial contextual information.
- Add dynamic real-time context to your visual playback.
✨ Unleash the full potential of your NMEA data! By taking control of display and styling, you transform raw data into insightful and visually captivating narratives.