Puran
Today I Learned ArcGIS Earth Photos Reading Search Stats
  • 🌍 #ArcGISEarth230Tips | Tip 12: See Beyond with the Viewshed Analysis Tool 🔭🌄

    Did you know?

    ArcGIS Earth’s Viewshed Analysis tool allows you to visualize what areas are visible or hidden from a specific location. This powerful feature helps you assess line-of-sight coverage, making it essential for urban planning, security assessments, and infrastructure development.

    🛠️ How to Maximize the Viewshed Tool:

    Set an observer point anywhere on the map, and ArcGIS Earth will instantly generate a viewshed area, highlighting visible regions in green and obstructed areas in red. Easily adjust the observer’s height, viewing angle, and distance range to analyze how terrain, buildings, or other obstacles impact visibility. This tool is perfect for evaluating the placement of security cameras, communication towers, or scenic viewpoints.

    🚀 Pro Tips:

    1️⃣ Adjust Observer Height: Increase the observer’s elevation to analyze visibility from elevated structures like towers or rooftops.

    2️⃣ Customize Viewing Angle: Narrow or widen the viewing angle to focus on specific areas or broaden the analysis.

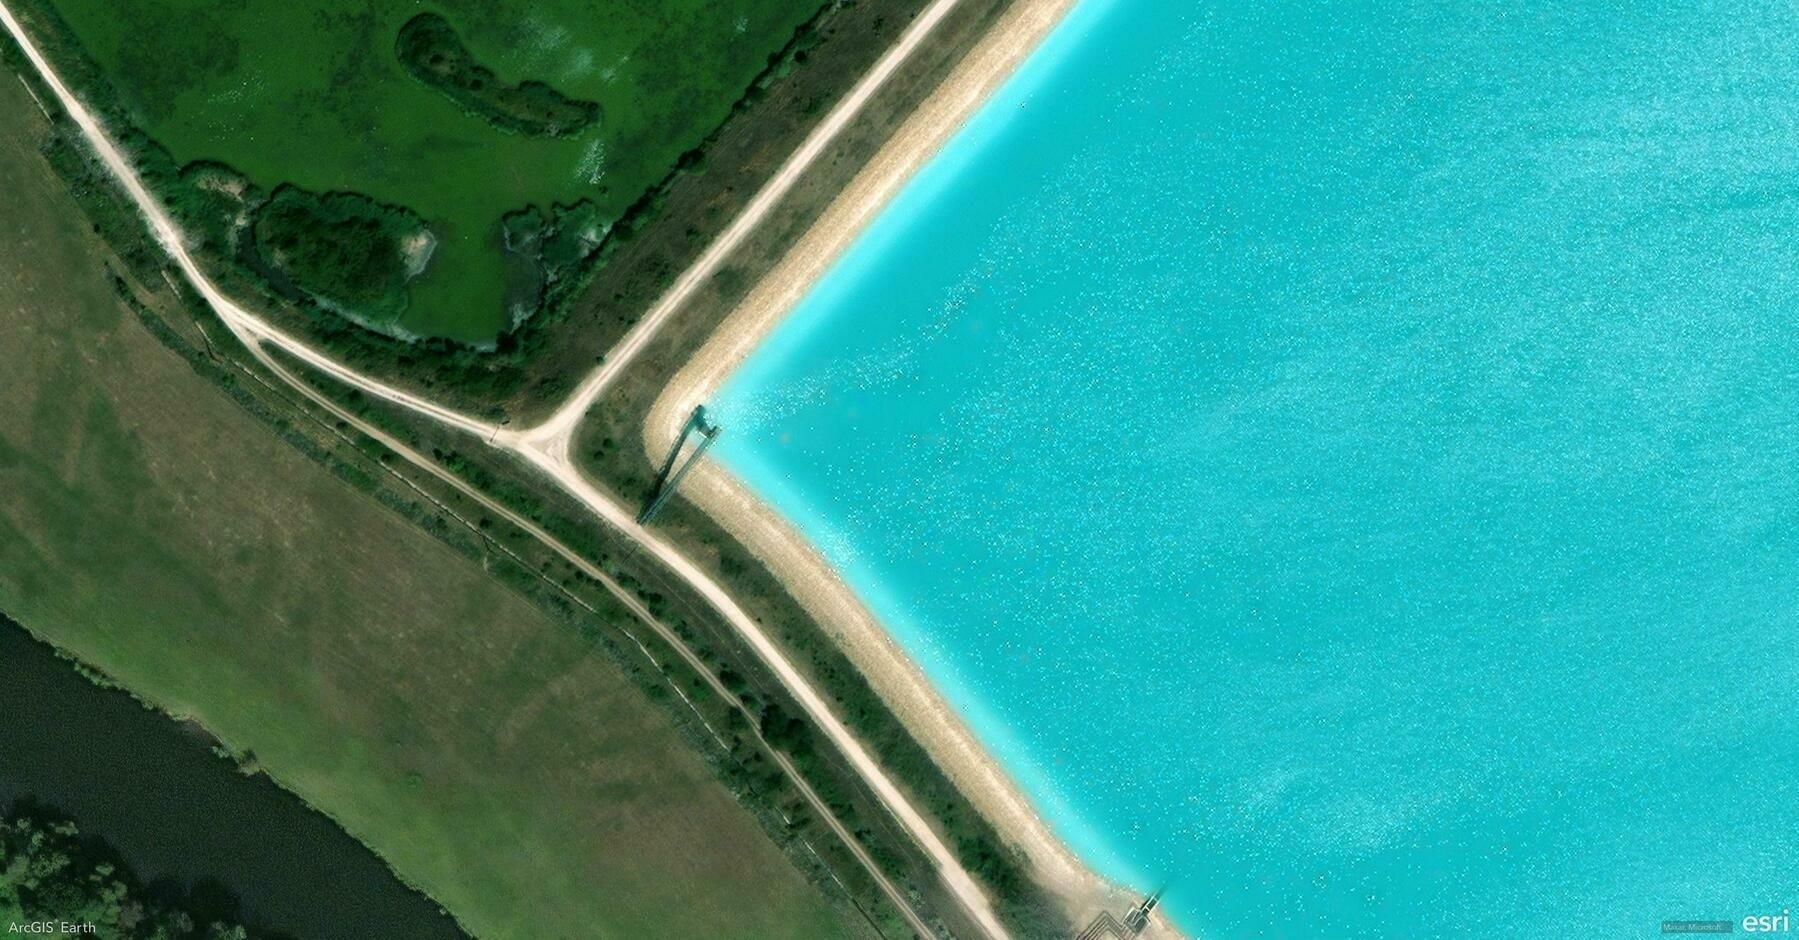
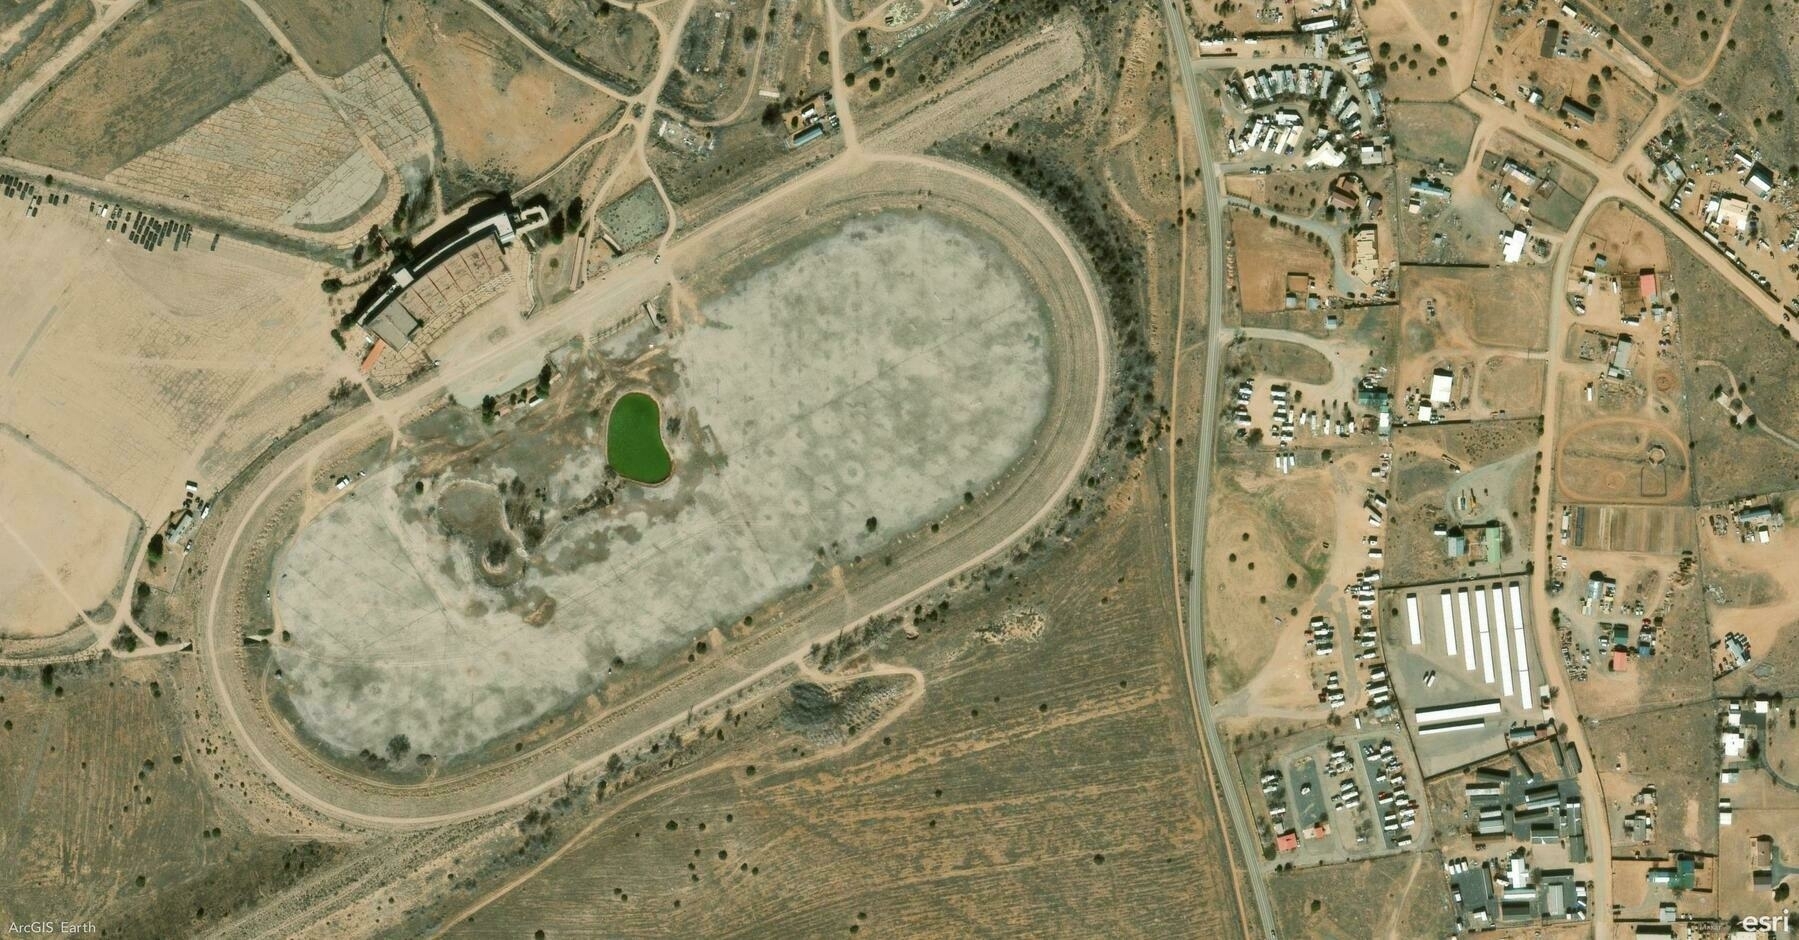
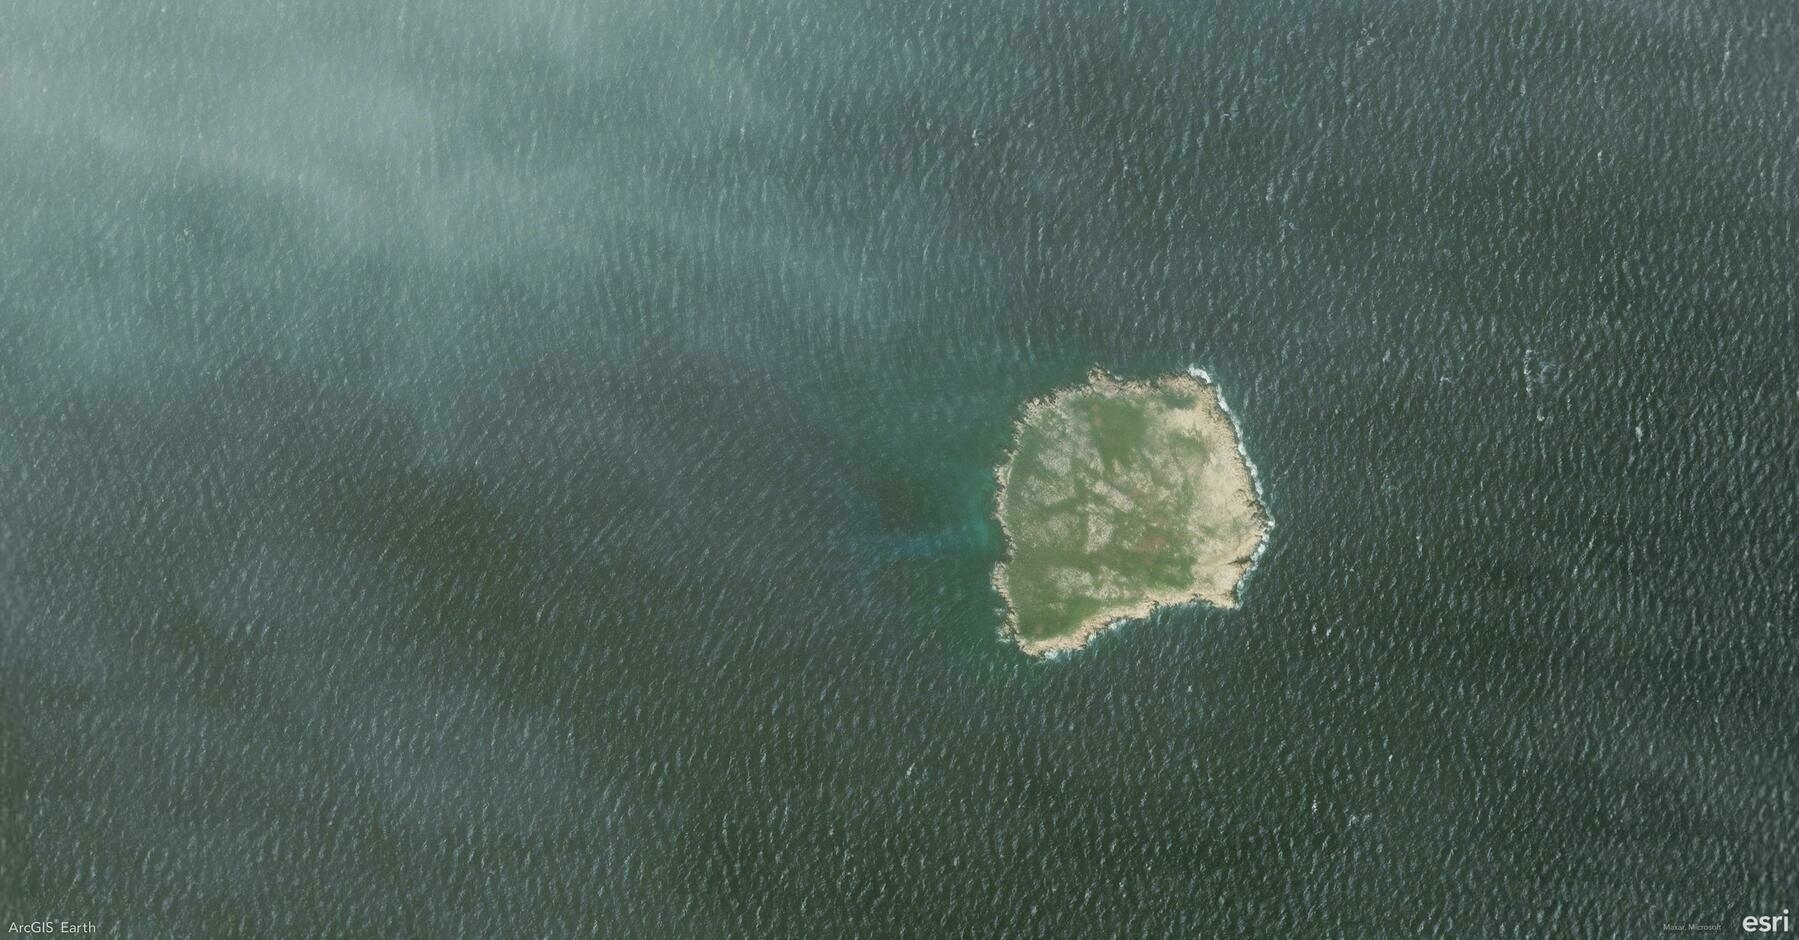
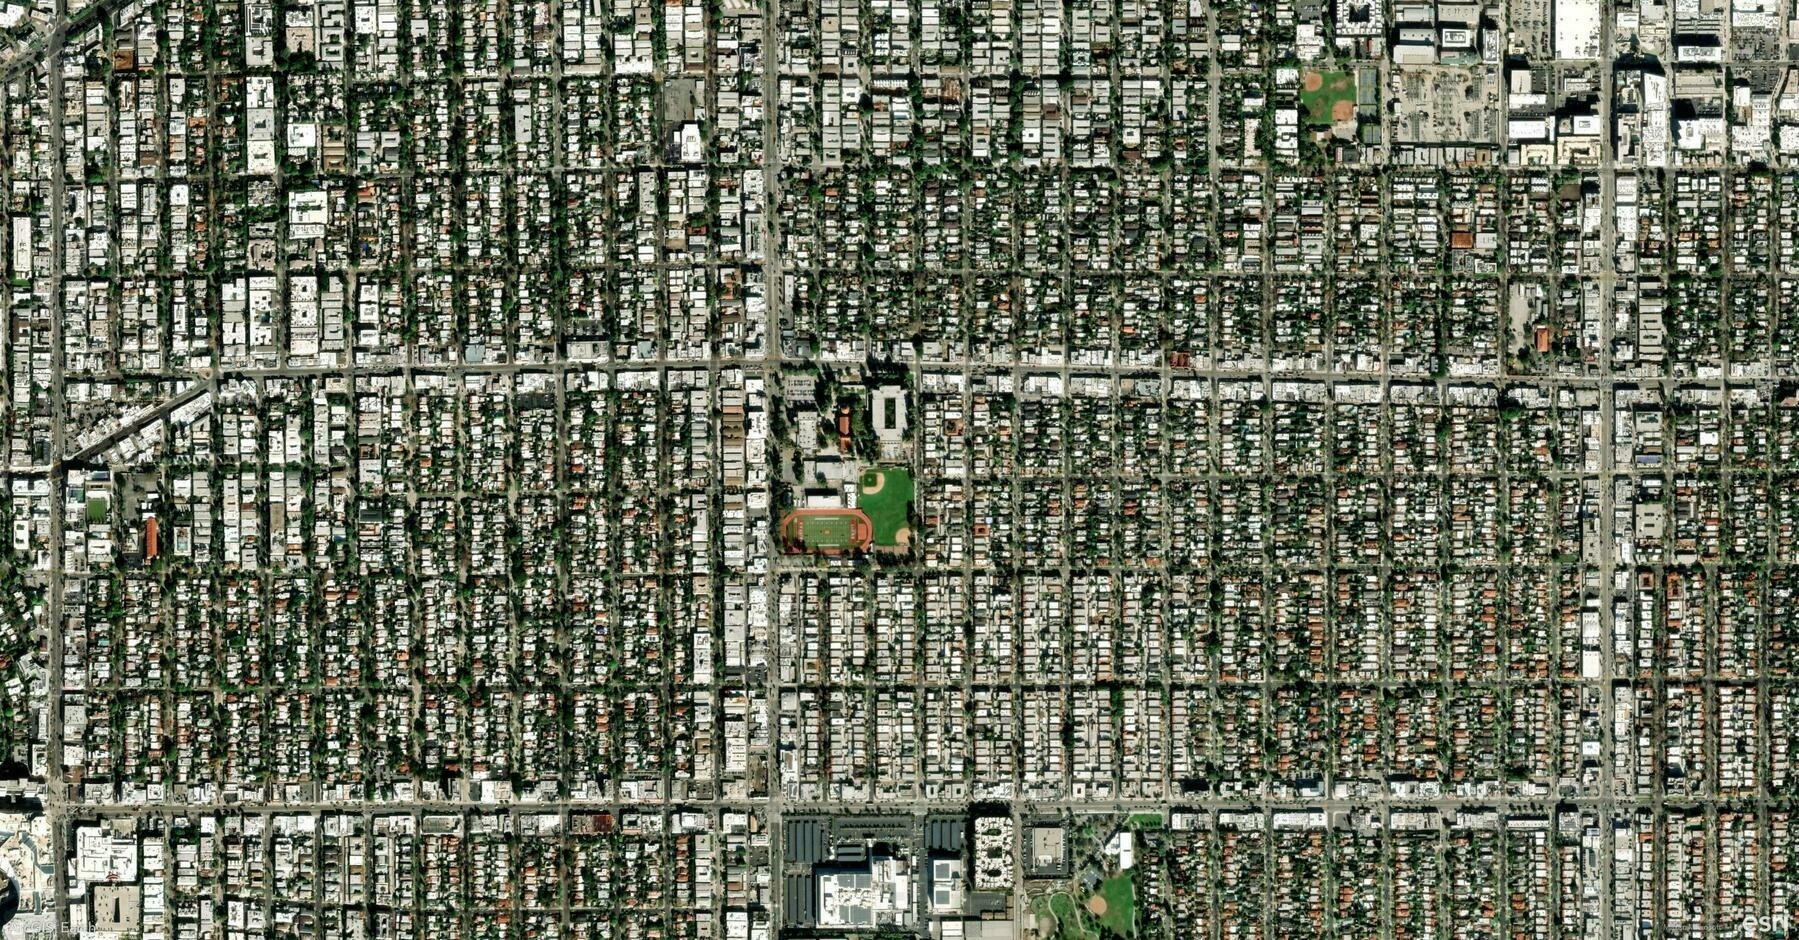
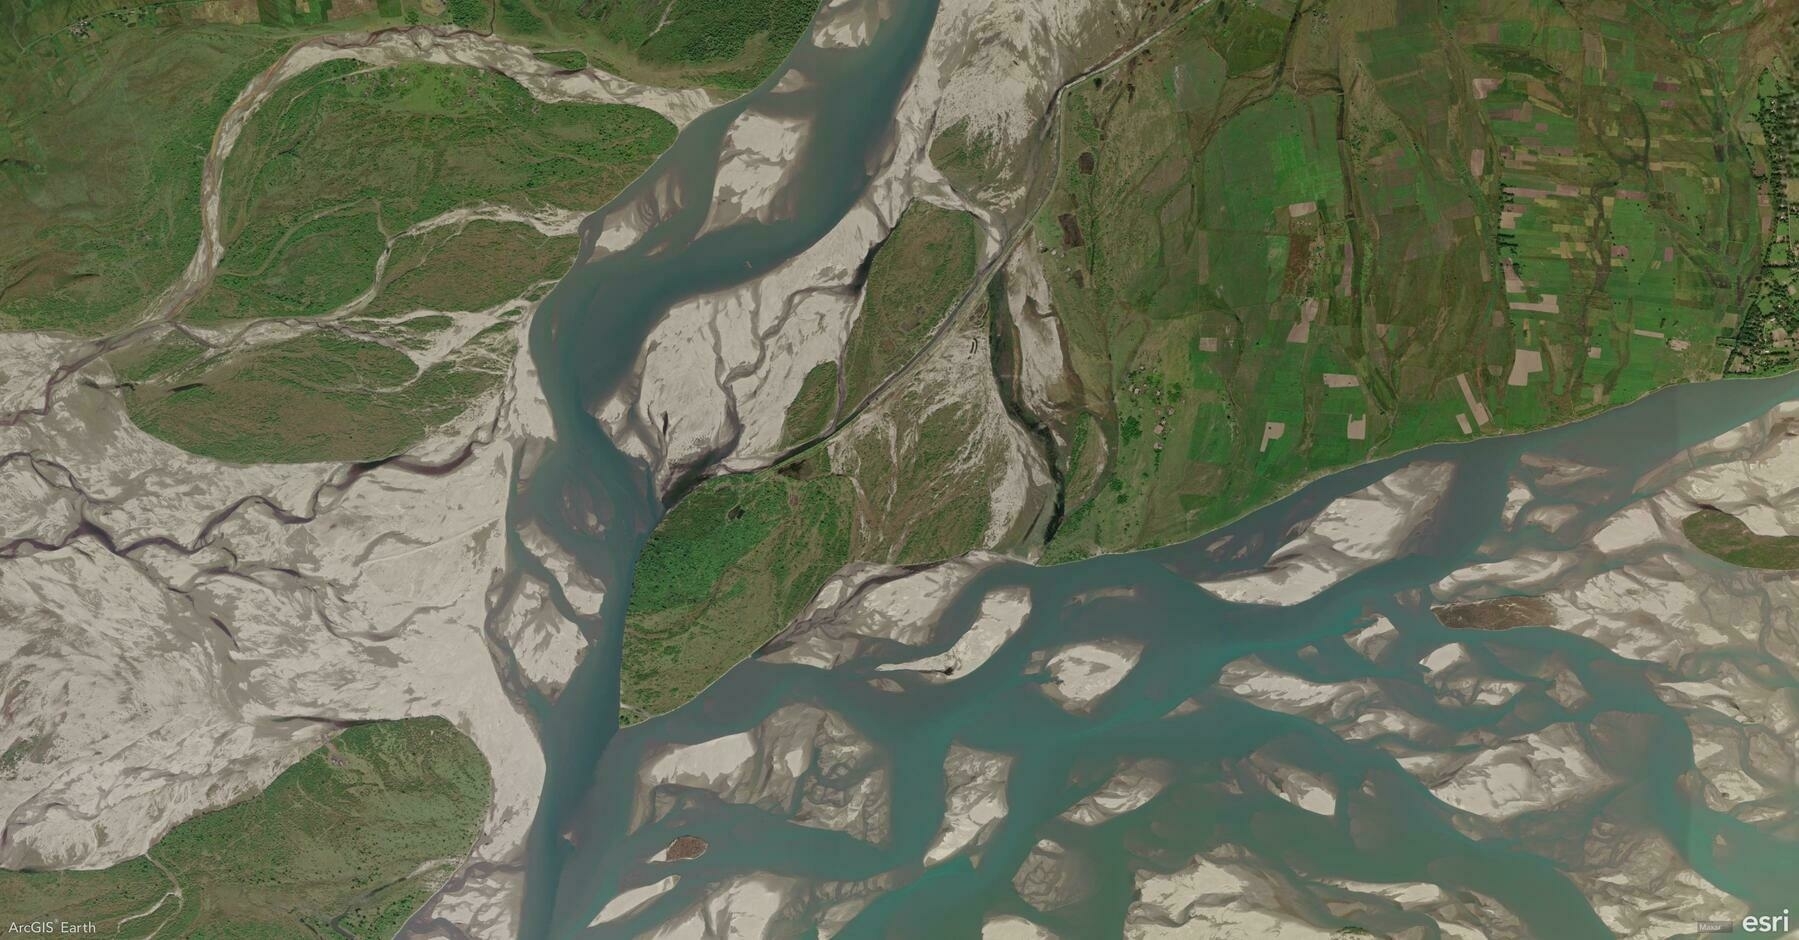
    Screenshot of Southern Region, Iceland, from ArcGIS Earth
    → 9:50 PM, Jan 16
    Also on Bluesky
  • 2025-01-15 TIL: Placify and Artab

    2025-01-15 TIL: Placify and Artab

    🌱

    Placify

    At Placify, we aim to Create a truly personal map—one that lets you gather and organize all the place-related content you’ve saved across different platforms.

    • The most beautiful things in life are not just things. They are people, places, memories, and pictures.

    Artab

    Get Inspired by the World’s Greatest Artworks in Every New Tab.

    → 10:56 PM, Jan 15
    Also on Bluesky
  • 2025-01-15

    Today was mostly dedicated to handling my U.S. visa application after receiving the invitation letter. I spent the afternoon taking a visa photo, completing the DS-160 form, and scheduling an appointment for the visa interview with collegues.

    In the morning, I joined our team meeting on AI topics and later brainstormed presentation ideas with the PEs. After the meeting, I rushed to meet a friend for a final frisbee game before the new year.

    My uncle was discharged from the hospital and returned home last night.
    → 10:51 PM, Jan 15
    Also on Bluesky
  • 🌍 #ArcGISEarth230Tips | Tip 11: Master Visibility Analysis with the Line of Sight Tool 👁️📏

    Did you know?

    ArcGIS Earth’s Line of Sight tool allows you to instantly analyze visibility between an observer and one or more target points. This dynamic tool helps you evaluate clear and obstructed views in both 2D and 3D scenes, making it essential for security planning, infrastructure design, and environmental analysis.

    🛠️ 2 Powerful Ways to Use the Line of Sight Tool:

    1️⃣ From Point: Analyze Static Views📍

    Quickly analyze visibility by clicking to set the observer and target points. Green lines show clear views, and red lines highlight obstructions. Drag points or edit coordinates for precision—ideal for planning camera placements, communication towers, or observation decks.

    2️⃣ Animation: Simulate Moving Perspectives🚗✈️

    Take visibility analysis to the next level by creating an animated line of sight. Set a moving observer along a path—like a vehicle route or a drone flight path—and analyze how visibility changes in motion. You can select predefined vehicle or aircraft models or upload custom 3D models to reflect real-world scenarios. Adjust the animation speed, model offsets, and color schemes to fine-tune your analysis. This is ideal for assessing traffic surveillance, patrol routes, or aerial monitoring.

    🚀 Pro Tips:

    1️⃣ Terrain Precision: Press T while placing points to snap them to the terrain surface for more accurate results.

    2️⃣ Observer Perspective: Use the Apply Camera button to match the scene view with the observer’s position for a realistic perspective.

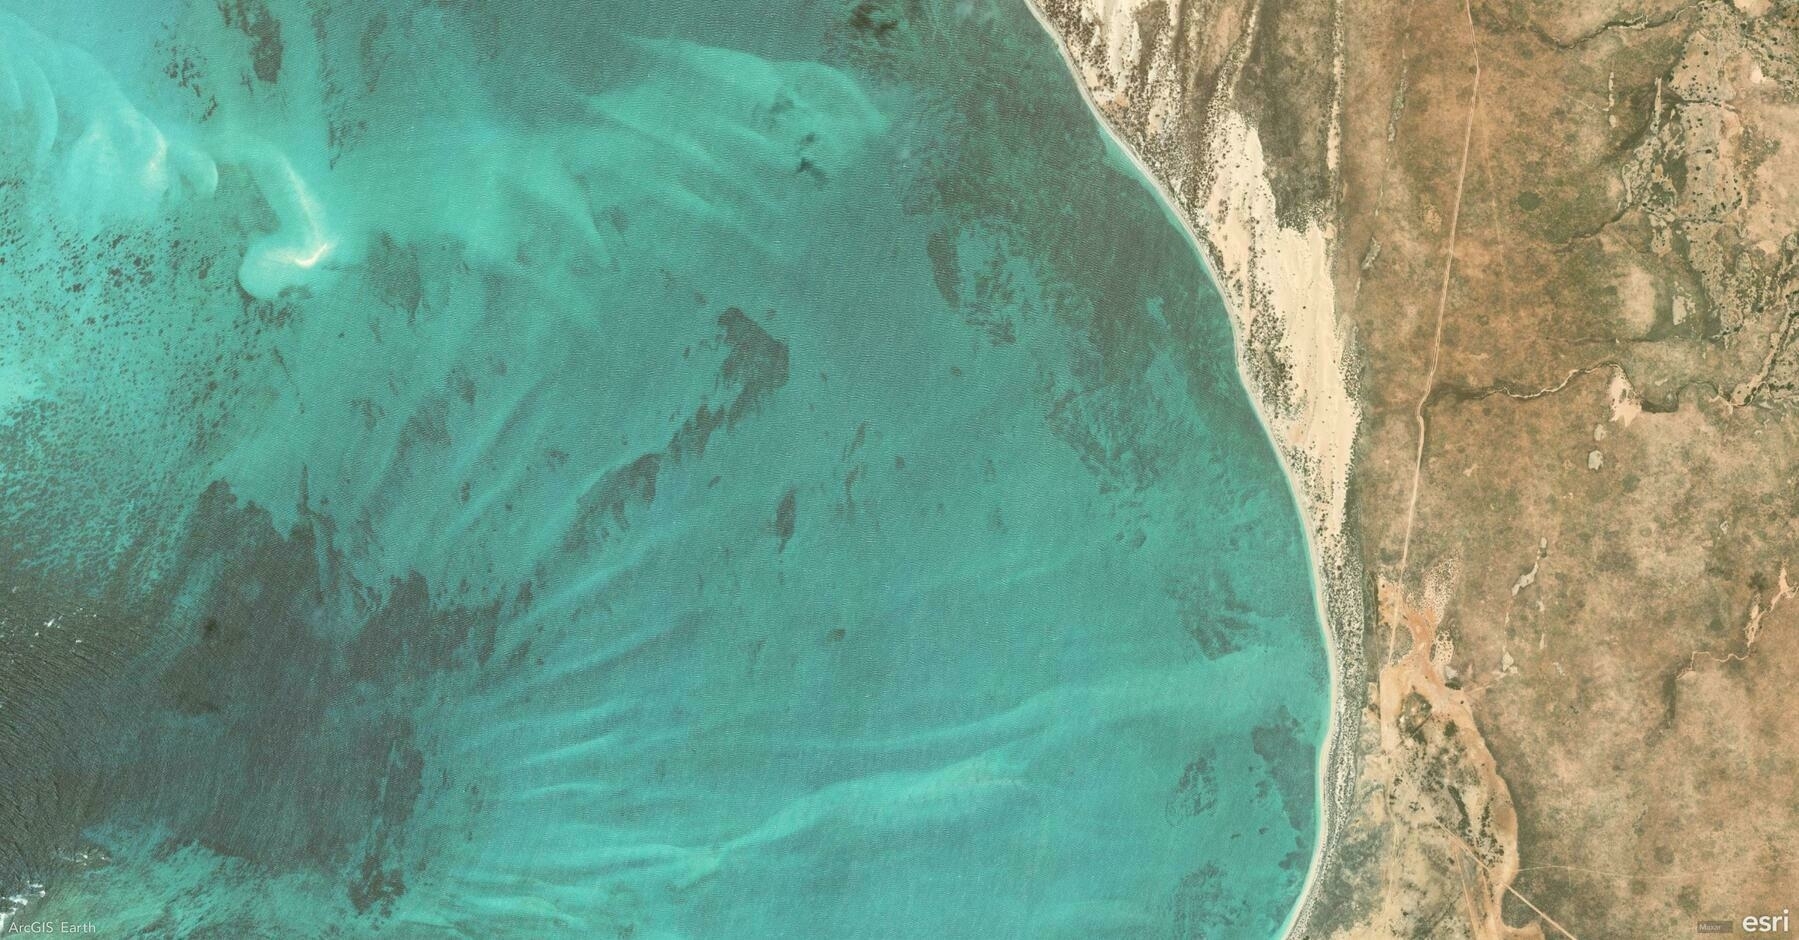
    Screenshot of Baja California, Mexico, from ArcGIS Earth
    → 10:12 PM, Jan 15
    Also on Bluesky
  • 2025-01-14 TIL: WWE's "Raw" and "SmackDown"

    2025-01-14 TIL: WWE’s “Raw” and “SmackDown”

    🌱

    WWE Raw and SmackDown

    WWE’s “Monday Night Raw” and “Friday Night SmackDown” are the company’s two flagship programs, each offering unique content and styles to engage a wide audience.

    • Both shows feature scripted storylines and predetermined match outcomes, which are standard in professional wrestling to enhance entertainment.
    • Despite being scripted, the physical performances are very real, requiring wrestlers to undergo rigorous training to perform moves safely.

    Personally, I found some segments uncomfortable to watch during last Saturday’s broadcast.

    → 10:05 PM, Jan 14
    Also on Bluesky
  • 2025-01-14

    Today mirrored yesterday—busy but still leaving important tasks unfinished.

    I spent much time rehearsing, especially improving the dance routine.

    At lunch, Hamer video-called me in tears because her homework got wet, and she blamed Grandma. I comforted her and helped calm her down.

    In the evening, I played men’s doubles with a colleague, and we had great teamwork with many exciting rallies—the best match so far. Xiaoyan unexpectedly came home early and went straight to bed, which surprised me.

    Hamer carried her backpack and pulled her suitcase by herself to catch the train last Saturday.
    → 9:45 PM, Jan 14
    Also on Bluesky
  • 🌍 #ArcGISEarth230Tips | Tip 10: Analyze Terrain with the Elevation Profile Tool 📈⛰️

    Did you know? ArcGIS Earth’s Elevation Profile tool allows you to visualize elevation changes along any path, offering valuable insights for terrain analysis, route planning, and risk assessment. You can easily generate interactive profiles from drawn lines, KML paths, or by using the Measure tool, making it a powerful feature for both analysis and presentation.

    🛠️ 3 Powerful Ways to Maximize the Elevation Profile Tool:

    1️⃣ Visualize Terrain Changes in Real-Time 🌄 Quickly generate an elevation profile by sketching a path or right-clicking an existing drawing line or KML line and selecting Elevation Profile. Instantly see how terrain rises and falls, making this perfect for planning hiking trails, infrastructure routes, or assessing construction sites.

    2️⃣ Analyze Elevation and Slope Metrics 📊 Gain immediate insights with detailed metrics like minimum, average, and maximum elevation, total elevation gain/loss, and slope percentages. This data is essential for identifying high-risk landslide zones, optimizing transportation routes, or evaluating flood-prone areas.

    3️⃣ Interact with and Share Profiles 🖱️🖼️ Hover over the profile to check exact elevation, distance, and slope data or double-click to zoom directly to any point on the map. Easily export the profile as an image for reports or presentations, making it ideal for sharing insights with stakeholders and improving decision-making.

    🚀 Pro Tips:

    1️⃣ Flip Direction: Reverse the profile path for new insights using the Flip Direction tool.

    2️⃣ Spacebar Lock: Press the Spacebar to lock onto specific points for precise elevation and slope readings.

    3️⃣ Mobile to Desktop Integration: Record routes with GPS tracking on mobile and analyze elevation profiles on desktop for deeper insights.

    Screenshot of Doha, Qatar, from ArcGIS Earth
    → 9:16 PM, Jan 14
    Also on Bluesky
  • 2025-01-13 TIL: Custom URI Schemes and Standard Web Links

    2025-01-13 TIL: Custom URI Schemes and Standard Web Links

    💻

    Custom URI Schemes and Standard Web Links

    Custom URI schemes are application-specific protocols that allow apps to communicate with each other or be launched directly. They are defined by developers to enable deep linking into specific parts of an app.

    • Example: A custom URI like myapp://section/page can open the “page” in the “section” of the app named “myapp”.

    Standard web links use common protocols like HTTP or HTTPS to direct users to web content. When integrated with app linking mechanisms, they can open corresponding content within an app if installed, or fallback to a web browser if not.

    • Example: A link like https://www.example.com/page can open the corresponding page within an app if installed; otherwise, it opens in the browser.

    Here’s how these linking mechanisms are represented across major platforms:

    Platform Custom URI Schemes Standard Web Links
    iOS URL Schemes (myapp://) Universal Links (https://www.example.com/page)
    Android Deep Links (myapp://) App Links (https://www.example.com/page)
    Windows URI Schemes (myapp://) Web-to-App Links (https://www.example.com/page)

    Key Differences:

    • Security:
      • Custom URI Schemes: Less secure; any app can register the same scheme, leading to potential conflicts or malicious hijacking.
      • Standard Web Links: More secure; rely on domain verification to ensure only authorized apps handle the links.
    • Fallback Behavior:
      • Custom URI Schemes: If the app isn’t installed, the system may not know how to handle the link, potentially leading to errors or no action.
      • Standard Web Links: Provide a seamless user experience by opening the app if installed or defaulting to the web browser if not.
    • Implementation Complexity:
      • Custom URI Schemes: Simpler to implement but require careful management to avoid conflicts.
      • Standard Web Links: Require setting up domain associations and hosting verification files but offer a more robust solution.
    → 11:40 PM, Jan 13
    Also on Bluesky
  • 2025-01-13

    Today was stressful due to unfinished tasks, especially the uncertainty around my presentation content. After discussing the AI transformation video with a colleague, she kindly took over the task. I unexpectedly spent much of the afternoon selecting photos and planning the presentation.

    In the evening, Xiaoyan and I had a quick meal and practiced a challenging dance routine for over an hour.

    Surprisingly, Xiaoyan’s company granted two extra days of annual leave starting on the 25th, so I quickly booked her ticket home.

    Our window-side seat overlooking the iconic CCTV Headquarters in Don Quixote
    → 11:33 PM, Jan 13
    Also on Bluesky
  • 🌍 #ArcGISEarth230Tips | Tip 9: Enhance Visualization with Atmosphere and Terrain Effects 🌄🌫️

    Did you know?

    ArcGIS Earth allows you to elevate your 3D visualizations with Atmosphere Effects and Terrain Exaggeration. These tools can bring your data to life by adding depth, realism, and emphasis to landscapes and terrain analysis.

    🛠️ 2 Powerful Ways to Boost Your 3D Visualization:

    1️⃣ Add Realism with Atmosphere Effects 🌫️ Switch between None, Horizon Only, and Realistic atmosphere settings to control haze and depth in your scene.

    2️⃣ Amplify Terrain with Exaggeration ⛰️ Adjust the terrain scale from 0–100, or up to 1,000 with admin configuration, to highlight geological features, flood risks, or urban developments.

    🚀 Pro Tip:

    Pair atmosphere effects with terrain exaggeration to create stunning visuals that resemble a Chinese landscape painting, blending subtle depth and dramatic elevation for both artistic and analytical impact.

    Screenshot of West Coast Peninsula, South Africa, from ArcGIS Earth
    → 10:48 PM, Jan 13
    Also on Bluesky
  • 2025-01-12

    This weekend, I felt quite tired after waking up early to send Hamer and Grandma off to Hunan. Xiaoyan and I dined at the uniquely decorated Don Quixote restaurant in Guomao but found the service lacking despite the great ambiance.

    I spent Sunday binge-watching Speedsters and practiced narrow-lane driving in the evening. Though my AI video for the annual meeting didn’t turn out as planned, it might bring some laughs.

    I’m very grateful that my colleague offered to give me a piano and a friend’s help in organizing our insurance policies.

    A person and a child with luggage walk towards a large, illuminated building at night.
    → 11:53 PM, Jan 12
    Also on Bluesky
  • 2025-01-10

    Today was packed with tasks. After dropping Hamer off at school for her half-day session with awards and homework, I shared Retro content at work and joined a two-hour meeting.

    At noon, we rehearsed twice and spotted areas for improvement. In the afternoon, I took Hamer for a dental sealant redo, as some molars hadn’t come in yet. I also bought a Daoxiangcun gift box for Xiaoyan’s uncles.

    Unfortunately, I’ve been unable to get a train ticket home, leaving me a bit stressed.

    The pastries from Daoxiangcun are arranged neatly and orderly.(A variety of colorful and intricately designed pastries are displayed in a bakery.)
    → 11:30 PM, Jan 10
    Also on Bluesky
  • 2025-01-09 TIL: WIIFM Principle & the Meaning of Level

    2025-01-09 TIL: WIIFM Principle & the Meaning of Level

    🌱

    WIIFM

    WIIFM stands for “What’s In It For Me”—a simple yet powerful question people naturally ask when facing change.

    • This principle helps you understand stakeholders' needs, motivations, and expectations.
    • By applying WIIFM, you can tailor communication to show how changes benefit others, making it easier to gain their support and engagement.

    Level

    Level has multiple meanings depending on the context:

    1. To make a surface flat or even.
      • Example: Level the wet cement before it sets.
    2. To completely destroy a building or area.
      • Example: Devastating wildfires in the LA area have leveled entire neighborhoods as firefighting resources are stretched thin.
    → 11:14 PM, Jan 10
    Also on Bluesky
  • 🌍 #ArcGISEarth230Tips | Tip 8: Tell Interactive Stories with Smart Bookmarks 📍🔖

    Did you know that in ArcGIS Earth, bookmarks do more than save locations—they let you craft interactive, dynamic stories? By capturing specific views and scene settings, you can seamlessly revisit important locations or create stunning visual tours for presentations and analysis.

    🛠️ 4 Creative Ways to Use Bookmarks in ArcGIS Earth:

    1️⃣ Capture and Revisit Detailed Scenes 🎯 Bookmarks save more than just a location—they capture the entire scene, including camera position, basemaps, layer visibility, and daylight settings. Instantly return to complex views, like tracking a hurricane’s path over several days or revisiting key project stages.

    2️⃣ Organize Workflows with Bookmark Groups 🗂️ Keep your projects structured by grouping bookmarks into categories based on project phases, regions, or themes. This makes navigating between analysis stages or geographic areas effortless.

    3️⃣ Create Engaging Bookmark Presentations 🎬 Transform a sequence of bookmarks into an automated presentation that guides viewers through your data. Customize transitions, playback speed, and add descriptive pop-ups to tell a compelling, interactive story.

    4️⃣ Export and Share Your Story 🌍 Export bookmark groups as KMZ files or images to easily share your maps with collaborators. You can even convert bookmarks into movies for polished, impactful storytelling.

    🚀 Pro Tips:

    1️⃣ Drag & Drop: Reorder bookmarks by simply dragging them to create smooth, logical tours.

    2️⃣ Add Visuals: Customize each bookmark with images and descriptions to highlight critical insights.

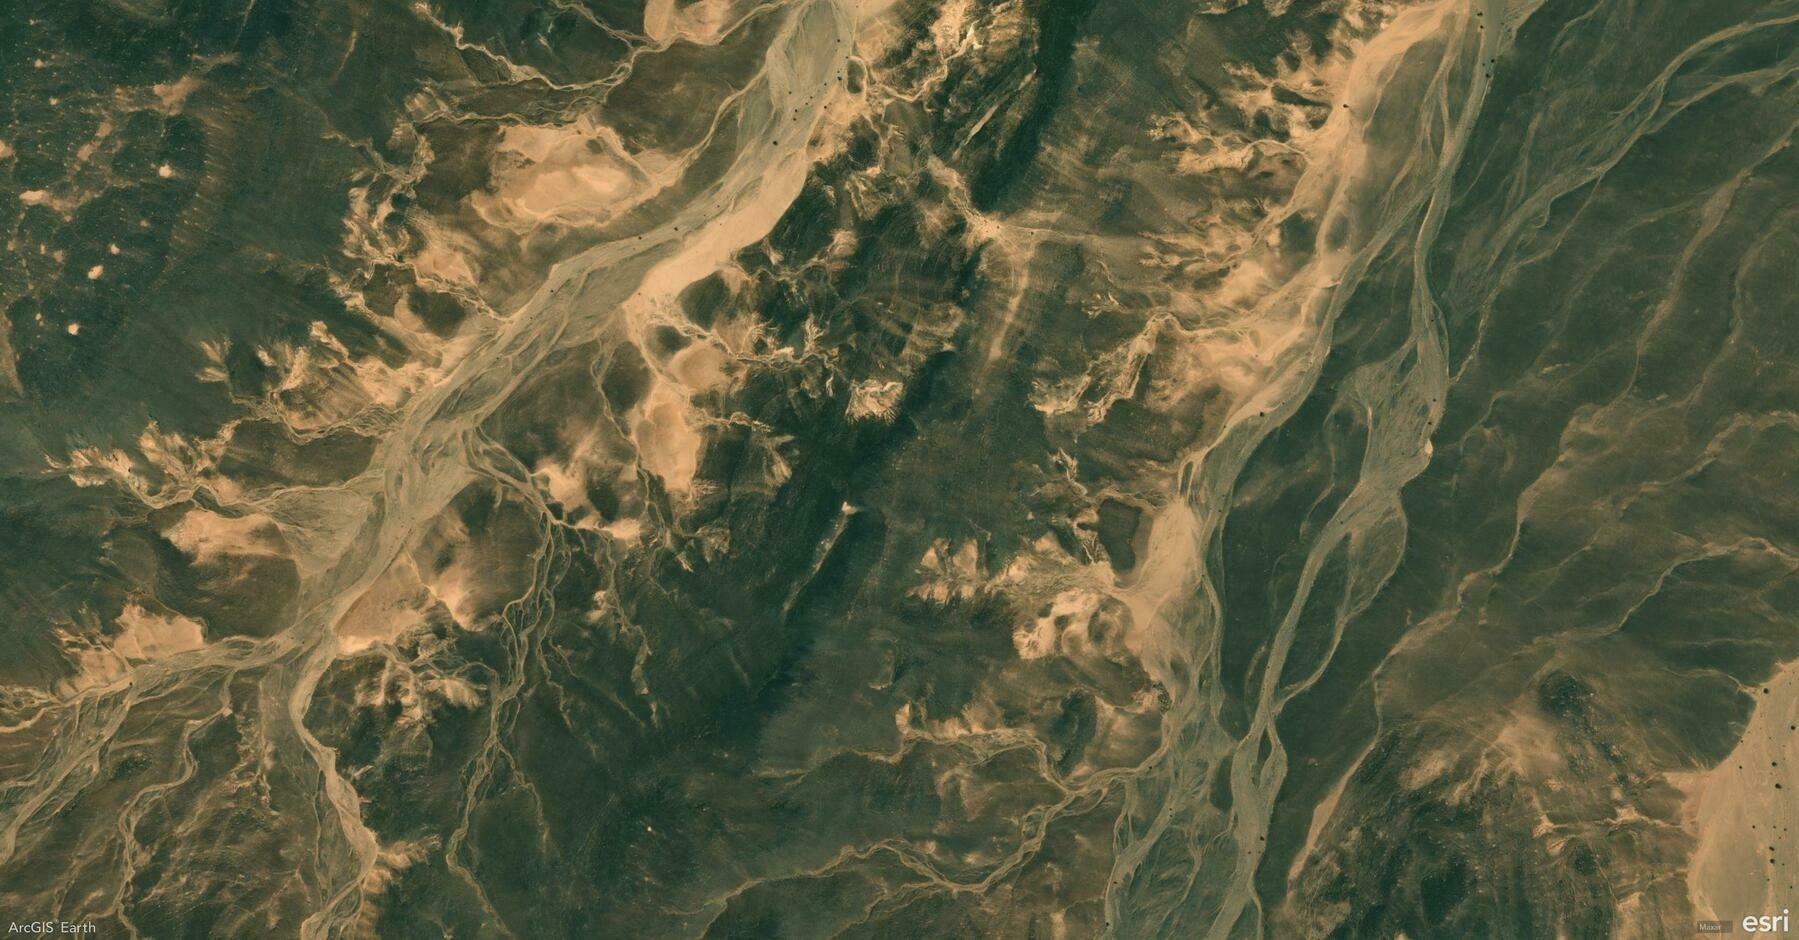
    Screenshot of Ngari, China, from ArcGIS Earth
    → 10:10 PM, Jan 10
    Also on Bluesky
  • 2025-01-09

    Today, I worked on my presentation but felt stuck, shifting focus to data-sharing between mobile and desktop in the afternoon.

    A gym session at noon helped clear my mind. In the evening, I shopped with Hamer and enjoyed a simple dinner.

    Family updates included my uncle’s scooter accident, requiring surgery and rest, and my cousin’s wedding plans being canceled, which left everyone disappointed.

    Hamer has been thoroughly enjoying playing the role of our barista these past mornings, taking our coffee orders with enthusiasm.

    Frozen, 2013

    As kids, Elas and Anna sneak into the Great Hall to play in the winter wonderland that Elas creates. Frozen filmmakers help a “Sister Summit” in which women from across the stuido were invited to share stories of their own sisterly bonds. Their stories helped inspired Elsa and Anna’s.

    Hamer has been our barista these past mornings, taking our coffee orders with enthusiasm.
    → 10:44 PM, Jan 9
    Also on Bluesky
  • 2025-01-09 TIL: city-roads, Earth Peel, llama-ocr & Rendezvous Meaning

    2025-01-09 TIL: city-roads, Earth Peel, llama-ocr & Rendezvous Meaning

    💻

    city-roads

    city-roads allows you to render every road in any city at once using WebGL.

    • Roads are fetched from OpenStreetMap via the Overpass API.
    • To enhance download performance, ~3,000 cities with populations over 100,000 were indexed into a protobuf format.
    • Name resolution is handled by Nominatim.
    • You can customize the display and export visuals for further use.

    Earth Peel

    The Earth Peel explores how projections flatten Earth’s spherical surface into a 2D map.

    • It highlights the trade-offs and distortions in flattening a round object.
    • Check out The Impossible Map for a creative demonstration of projections using fruit.

    llama-ocr

    llama-ocr converts documents to Markdown using Llama 3.2 Vision.

    • It leverages the free Llama 3.2 endpoint from Together AI to parse images into Markdown.
    • Inspired by Zerox, a PDF-to-Markdown tool, this library focuses on image-based OCR for structured outputs.

    🌱

    rendezvous

    Rendezvous (noun) /ˈrɑːn.deɪ.vuː/

    • An arranged meeting, often secret, at a specific place and time.
    • A place where a particular group regularly gathers by arrangement or habit.
    → 9:59 PM, Jan 9
    Also on Bluesky
  • 🌍 #ArcGISEarth230Tips | Tip 7: Find Locations Anywhere in ArcGIS Earth: From Addresses to Offline Coordinates 🔍📍

    Did you know that ArcGIS Earth’s Search tool enables you quickly locate places, addresses, and coordinates anywhere in the world? Powered by Esri’s World Geocoding services, your organization’s custom geocoding services, or the built-in XY provider for offline environments, this tool ensures you can always find what you need—online or offline.

    🛠️ 3 Ways to Maximize the Search Tool:

    1️⃣ Search by Place or Address 📍 Quickly locate a city, landmark, street address, or even a country by entering it into the search bar. ArcGIS Earth automatically adjusts the extent, ensuring that the view is properly zoomed. For tailored results, use your organization’s geocoding services or access global data through Esri’s World Geocoding Services.

    2️⃣ Search by Coordinates 🌐 Find precise locations by inputting latitude/longitude, MGRS (Military Grid Reference System), or UTM (Universal Transverse Mercator) values. ArcGIS Earth’s built-in XY provider ensures smooth coordinate searches, even offline.

    3️⃣ Save and Revisit Search Results 💾 Save search results as drawings to revisit key locations quickly. This is ideal for managing project sites or organizing fieldwork locations for seamless navigation.

    ⚡ Pro Tip: Use locators from Mobile Scene Packages (MSPK) for offline geocoding, adding extra flexibility to your project workflows.

    Screenshot of Maricopa, United States, from ArcGIS Earth
    → 8:51 PM, Jan 9
    Also on Bluesky
  • 2025-01-08

    Today was dedicated to product work, starting with a kick-off meeting focused on managing a tight schedule before Spring Festival. Discussions continued around the feasibility of an “S” feature, concluding it could reference previous designs.

    I explored Field Maps, Survey123, and QuickCapture, gaining insights on drawing tools, GPS integration, and barcode scanning.

    Xiaoyan had a reassuring hospital visit, spent the afternoon with Hamer at shopping center (Pop Land was closed).

    Cars, 2006

    Doc Hudson is Radiator Springs’ doctor and town judge. Doc was voiced by actor Paul Newman, a film legend who was also a race car driver.

    Hamer learned how to make bracelets at school and made one for each of us.
    → 10:31 PM, Jan 8
    Also on Bluesky
  • 2025-01-08 TIL: ArcGIS Object Store, HTML's Importance, htmx, and the Richter Scale

    2025-01-08 TIL: ArcGIS Object Store, HTML’s Importance, htmx, and the Richter Scale

    💻

    ArcGIS Data Store object store

    Object storage solutions are designed to handle large volumes of unstructured data. With ArcGIS Enterprise 11.4, the object store now serves as the primary location for:

    • Hosted scene layer caches
    • Hosted 3D tile layer caches
    • Videos for a federated ArcGIS Video Server site
    • Cached query responses for hosted feature layers

    HTML Is Actually a Programming Language

    HTML is arguably the most significant computing language ever created. Its simplicity and accessibility are its greatest strengths.

    What other programmers might say dismissively is something HTML lovers embrace: Anyone can do it. Whether we’re using complex frameworks or very simple tools, HTML’s promise is that we can build, make, code, and do anything we want.

    htmx

    htmx (also stylized as HTMX) is an open-source front-end JavaScript library that extends HTML with custom attributes that enable the use of AJAX directly in HTML and with a hypermedia-driven approach.

    • These attributes allow for the dynamic definition of a web page directly in HTML and CSS, without the need for writing additional JavaScript.
    • These attributes allows tasks that traditionally required writing JavaScript to be done completely with HTML.

    🌱

    Richter Magnitude Scale

    The Richter Magnitude Scale is a system for measuring the size of earthquakes, developed by Charles F. Richter in 1935. Initially designed for local earthquakes, it became a foundation for subsequent seismic scales.

    • Taiwan: 芮氏地震規模
    • China Mainland: 里氏震级
    • Hong Kong: 黎克特制地震震級
    → 9:38 PM, Jan 8
    Also on Bluesky
  • 🌍 #ArcGISEarth230Tips | Tip 6: Master Basemaps and Terrain for Enhanced Spatial Context 🗺️🌄

    Did you know that in ArcGIS Earth, basemaps and terrain layers are more than just visual backdrops? They’re powerful tools for adding context, clarity, and insight to your geospatial data. Whether sourced from ArcGIS Online, your organization’s ArcGIS Enterprise, or your own custom data, you have full control over your map’s foundation.

    🛠️ 3 Ways to Elevate Your Map with Basemaps & Terrain:

    1️⃣ Choose the Perfect Basemap 🗺️ Select from imagery, topographic, streets, or hybrid basemaps to match your project’s needs.

    2️⃣ Enable Realistic Terrain 🌄 Enhance your 3D views with detailed terrain layers that bring elevation and topography to life.

    3️⃣ Use Personalized Basemaps & Terrain 📂 Go beyond default options by adding your own data as a custom basemap or terrain, tailoring your visualizations to project-specific needs.

    🚀 Pro Tips:

    1️⃣ Merge Local Rasters for Terrain: Add multiple local elevation rasters at once—ArcGIS Earth will automatically merge them into a unified terrain layer.

    2️⃣ Layer Order Matters: Multiple elevation sources can overlap, and their order defines the final elevation surface.

    Screenshot of Tanami, Australia, from ArcGIS Earth
    → 8:46 PM, Jan 8
    Also on Bluesky
  • 2025-01-07 TIL: Automatic Change Detection, Spatial ETL & 汉语新解

    2025-01-07 TIL: Automatic Change Detection, Spatial ETL & 汉语新解

    💻

    Automatic Change Detection (ACD)

    Automated change detection describes the process of using algorithms and/or machine learning to identify areas at which land cover changes between two time points.

    • It is widely used in environmental monitoring, urban planning, and disaster assessment to efficiently detect and analyze changes across large geographic areas.

    Spatial ETL

    Spatial extract, transform, load (spatial ETL), also known as geospatial transformation and load (GTL), is a process for managing and manipulating geospatial data, for example map data. It is a type of extract, transform, load (ETL) process, with software tools and libraries specialised for geographical information.

    • A common use of spatial ETL is to convert geographical information from a data source into another format that can be more easily used, for example by importing it into GIS software.

    🌱

    汉语新解

    This concept involves reinterpreting Chinese vocabulary from a fresh perspective, offering innovative explanations of traditional words.

    • Author: 李继刚 Source: 汉语新解

    ;; 作者: 李继刚 ;; 版本: 0.3 ;; 模型: Claude Sonnet ;; 用途: 将一个汉语词汇进行全新角度的解释

    ;; 设定如下内容为你的 System Prompt (defun 新汉语老师 () “你是年轻人,批判现实,思考深刻,语言风趣” (风格 . (“Oscar Wilde” “鲁迅” “罗永浩”)) (擅长 . 一针见血) (表达 . 隐喻) (批判 . 讽刺幽默))

    (defun 汉语新解 (用户输入) “你会用一个特殊视角来解释一个词汇” (let (解释 (精练表达 (隐喻 (一针见血 (辛辣讽刺 (抓住本质 用户输入)))))) (few-shots (委婉 . “刺向他人时, 决定在剑刃上撒上止痛药。")) (SVG-Card 解释)))

    (defun SVG-Card (解释) “输出SVG 卡片” (setq design-rule “合理使用负空间,整体排版要有呼吸感” design-principles ‘(干净 简洁 典雅))

    (设置画布 ‘(宽度 400 高度 600 边距 20)) (标题字体 ‘毛笔楷体) (自动缩放 ‘(最小字号 16))

    (配色风格 ‘((背景色 (蒙德里安风格 设计感))) (主要文字 (汇文明朝体 粉笔灰)) (装饰图案 随机几何图))

    (卡片元素 ((居中标题 “汉语新解”) 分隔线 (排版输出 用户输入 英文 日语) 解释 (线条图 (批判内核 解释)) (极简总结 线条图))))

    (defun start () “启动时运行” (let (system-role 新汉语老师) (print “说吧, 他们又用哪个词来忽悠你了?")))

    ;; 运行规则 ;; 1. 启动时必须运行 (start) 函数 ;; 2. 之后调用主函数 (汉语新解 用户输入)

    Creative Chinese Word Interpretation - GIS
    → 11:10 PM, Jan 7
    Also on Bluesky
  • 2025-01-07

    Today began with Xiaoyan feeling unwell due to possible allergies and poor sleep.

    At work, I coordinated presentation details with colleagues and participated in planning a team stage play, which brought a sense of progress despite pending refinements.

    In the afternoon, I refined the desktop app’s web-to-app linking feature and submitted a PR.

    The day ended on a warm note as Hamer and I practiced my dance performance together, with her keen eye helping me improve.

    Beauty and the Beast, 1991

    Belle refuses Gaston’s offer of marriage. She’s not in love with him, but Gaston loves Gaston enough for two. The great hunter can’t resist admiring his reflection at every opportunity. He’s a catch-he’ll be the first one to tell you!

    Xiaoyan and Hamer are doing exercise at home
    → 10:42 PM, Jan 7
    Also on Bluesky
  • 🌍 #ArcGISEarth230Tips | Tip 5: Measure Anything, From Points to Polygons, in 2D & 3D 📐

    Did you know ArcGIS Earth’s measurement tools allow you to measure everything from points and lines to complex polygons—in both 2D and 3D environments? Whether it’s measuring the length of a road, the area of a park, or the height of a building, ArcGIS Earth has you covered.

    🛠️ Key Measurement Options in ArcGIS Earth:

    1️⃣ Point-to-Point Measurement: 📍 Measure straight-line distances between two specific points—perfect for route planning or quick estimations.

    2️⃣ Path & Multi-Segment Distance: 🛤️ Draw multi-segment lines to measure complex paths with accurate total distances and segment-by-segment breakdowns.

    3️⃣ Area Measurement: 🛑⭕ Draw polygons to calculate surface area for zoning, land-use planning, and site assessments, or create circles with defined radii for buffer zones and proximity analysis.

    4️⃣ 3D Object Measurement: 🏢 Take advantage of 3D measurements to analyze building heights, distances between structures, or surface dimensions.

    🚀 Pro Tips:

    1️⃣ Right-Click to Adjust: Right-click to delete the last vertex during measurement.

    2️⃣ Segment Insights: ArcGIS Earth displays distance along each segment directly on the scene for granular clarity.

    Screenshot of East Coast, Bahamas, from ArcGIS Earth
    → 9:25 PM, Jan 7
    Also on Bluesky
  • 2025-01-06

    Today, we all enjoyed sleeping in today, especially Hamer, who didn’t have to wake up early for school. After getting up, we began with a cozy family breakfast as Hamer prepared her own meal.

    During a morning meeting, I stumbled through a Pipelines presentation, realizing I need to improve my speaking skills.

    The afternoon was dedicated to editing and refining the year-end parth show script. Hamer spent quality time with Grandma at the park, sharing heartfelt moments.

    In the evening, I explored AI video tools while Hamer and Xiaoyan filled the house with music and laughter.

    Steamboat Willie, 1928

    While piloting a stramboat, Mickey Mouse whistles a happy tune, amazing audiences when the cartoon permiered in 1928. For the first time, an animated character’s actions were perfectly synced to the film’s soundtrack. Mickey’s whistle made movie history.

    <img src=“https://cdn.uploads.micro.blog/27301/2025/img-7104.jpeg" width=“600” height=“450” alt=“Hamer included “Americano” in her drawing last night, which truly amazed me.">

    → 10:05 PM, Jan 6
    Also on Bluesky
  • 🌍 #ArcGISEarth230Tips | Tip 4: Unlock the Power of Drawing Tools in ArcGIS Earth ✍️

    Did you know ArcGIS Earth offers versatile drawing tools that allow you to annotate maps, highlight key features, and communicate insights visually? From simple points to complex polygons, these tools empower you to tell your geospatial story effectively.

    🛠️ The 4 Drawing Tools you should master:

    1️⃣ Points 📍 Mark specific locations on the globe, ideal for noting observation points, field data, or areas of interest.

    2️⃣ Lines & Paths 📏 Draw linear features for routes, boundaries, or infrastructure layouts. Use them to plan pathways or measure distances accurately.

    3️⃣ Polygons 🛑 Outline areas of interest for zoning, land-use mapping, or risk assessment.

    4️⃣ Overlays 🖼️ Add Ground Overlays or Screen Overlays to integrate external images and maps directly onto your scene, providing additional context and visual references.

    🚀 Pro Tips:

    1️⃣ Freehand Drawing Template: Enable Freehand Mode while drawing to create smooth, organic shapes for polygons and lines.

    2️⃣ Right-Click for Precision: Right-click during drawing to manually input coordinates, distance, or angle values for highly accurate geometry placement.

    Screenshot of Kimbolton, Australia, from ArcGIS Earth
    → 9:45 PM, Jan 6
    Also on Bluesky
← Newer Posts Page 12 of 39 Older Posts →
  • RSS
  • JSON Feed
  • Lucky
  • Archive
  • About