Puran
TIL Photos Reading Weekly Current Shelf Search Stats
  • ๐ŸŒ #ArcGISEarth230Tips | Tip 28: Visualize Changes Over Time with Time-Enabled Data Animation โณ๐Ÿ“Š

    Did you know?

    ArcGIS Earth provides powerful time-based animation tools that allow you to track changes in spatial data over time. Whether analyzing climate change, infrastructure development, or disaster progression, the time slider and playback controls help bring your data to life with smooth, intuitive animations.

    ๐Ÿ› ๏ธ How to Use Time-Enabled Data Animation in ArcGIS Earth:

    1๏ธโƒฃ Load and Activate Time-Enabled Data โณ Add KML/KMZ files, feature services, or image services that contain time attributes. The time slider appears automatically at the bottom of the screen and dynamically adjusts based on active layers.

    2๏ธโƒฃ Control and Navigate Temporal Data ๐ŸŽ›๏ธ Drag the time slider or select specific dates to set the start and end time. Click Play to animate the dataset and use Next/Previous buttons to step through time intervals.

    3๏ธโƒฃ Customize Playback for Better Analysis ๐ŸŽฅ Fine-tune playback by setting it to repeat, reverse, or stop after a full cycle. Adjust animation speed for faster or slower transitions. Switch between UTC and local time for accurate time zone adjustments.

    ๐Ÿš€ Pro Tips:

    1๏ธโƒฃ Analyze Multi-Layer Time Series โ€“ Overlay multiple time-enabled datasets (e.g., wildfire spread and population density) to observe interactions over time. 2๏ธโƒฃ Optimize Performance โ€“ Enable only relevant KML nodes to ensure smooth animations without unnecessary visual clutter. 3๏ธโƒฃ Refine Time Ranges โ€“ Adjust time intervals to highlight key events and make trends more apparent.
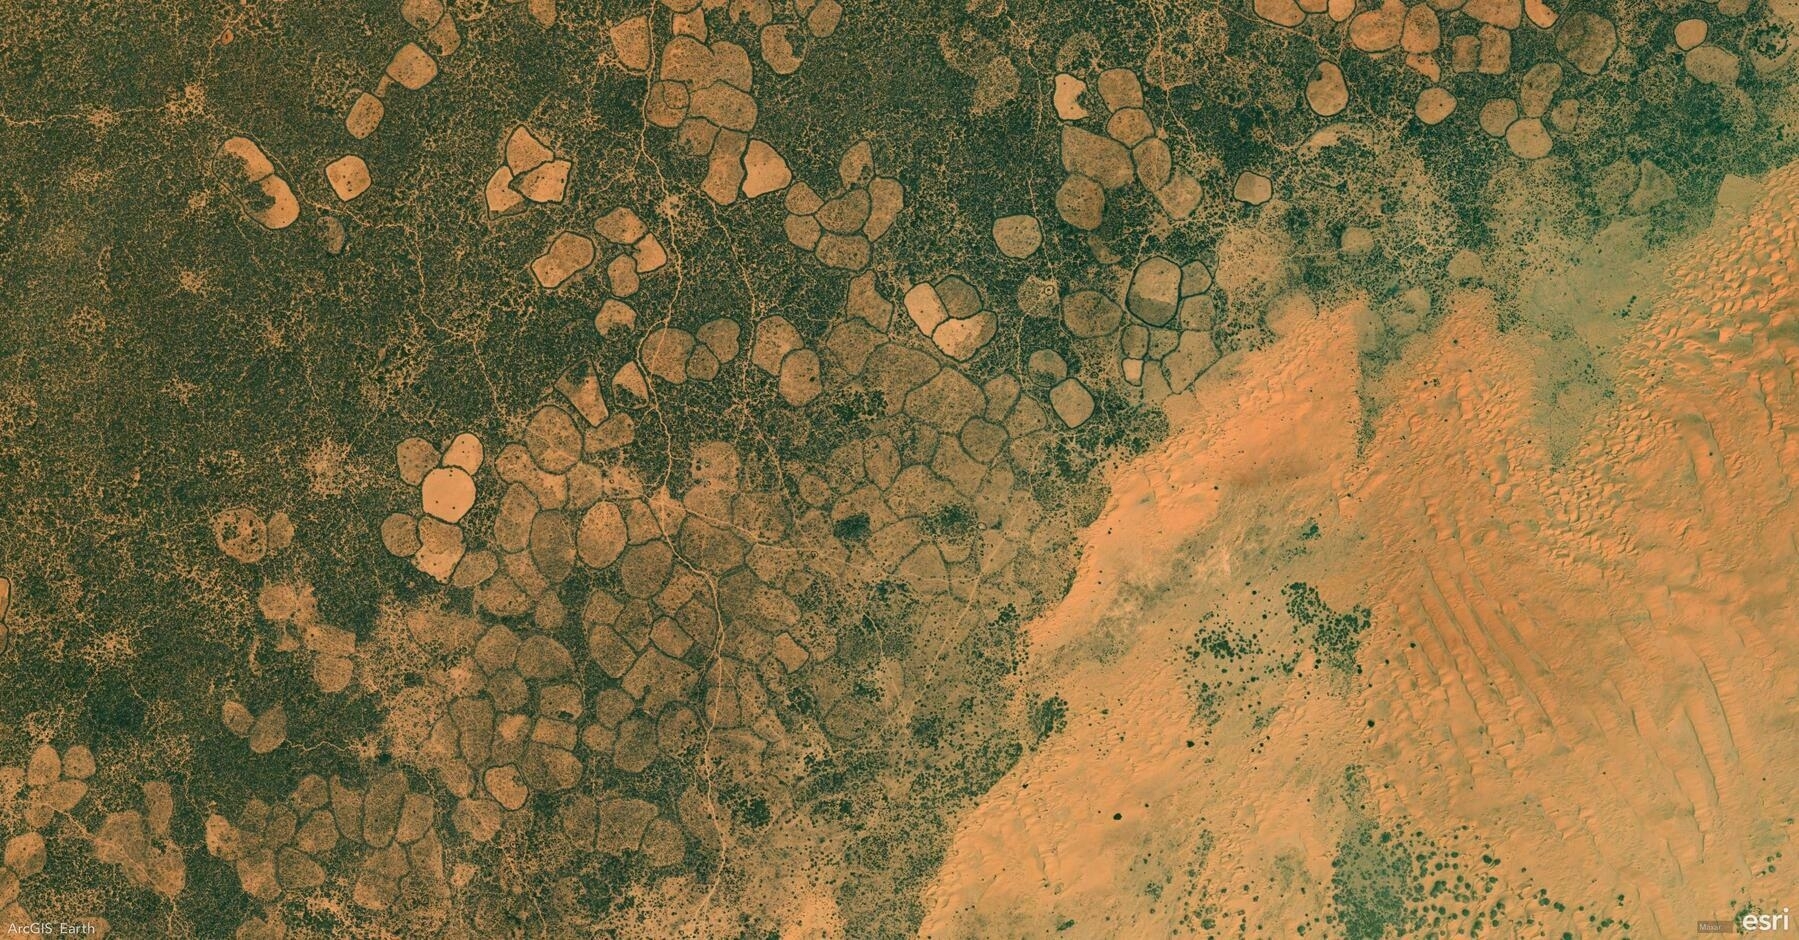
    Screenshot of Ceel Dheer, Somalia, from ArcGIS Earth
    โ†’ 8:45 PM, Feb 28
    Also on Bluesky
  • ๐ŸŒ #ArcGISEarth230Tips | Tip 27: Organize and Interpret Data with the Table of Contents & Legends ๐Ÿ“‘๐Ÿ—บ๏ธ

    Did you know?

    ArcGIS Earthโ€™s Table of Contents (TOC) and Legends provide an intuitive way to manage layers, control visibility, and interpret symbology. The TOC helps you organize, reorder, and customize layers, while the Legend panel offers a clear reference for symbol meanings, improving data interpretation.

    ๐Ÿ› ๏ธ How to Use the Table of Contents and Legends in ArcGIS Earth:

    1๏ธโƒฃ Manage Layers Efficiently in the TOC ๐Ÿ“‚ The TOC serves as a control center for managing layers, allowing you to toggle visibility, adjust transparency, reorder layers, and group related datasets for better organization.

    2๏ธโƒฃ Customize and Control Layers โš™๏ธ Right-clicking a layer or folder provides additional options, such as renaming, refreshing, removing, adjusting symbology, viewing properties, and exporting layers as KMZ files for sharing.

    3๏ธโƒฃ Interpret Data Easily with Legends ๐Ÿ“œ The Legend Panel updates dynamically based on active layers, making it easier to understand map symbology. This is especially useful for land use classifications, hazard zones, and transportation networks, where colors and symbols differentiate categories.

    ๐Ÿš€ Pro Tips:

    1๏ธโƒฃ Use the Search in TOC to quickly locate layers by keyword. 2๏ธโƒฃ Group Layers for Organization โ€“ Keep related layers in folders to maintain a structured, clutter-free TOC. 3๏ธโƒฃ Optimize Legends for Presentations โ€“ Hide non-essential layers to focus on key map elements.

    Screenshot of Barcelona, Spain, from ArcGIS Earth
    โ†’ 10:20 PM, Feb 27
    Also on Bluesky
  • ๐ŸŒ #ArcGISEarth230Tips | Tip 26: Improve Map Readability with Labels in ArcGIS Earth ๐Ÿท๏ธ๐Ÿ—บ๏ธ

    Did you know?

    ArcGIS Earth allows you to add and customize labels to improve map clarity and interpretation. Whether you’re labeling cities, infrastructure, or geographic features, using clear, well-styled labels enhances your spatial analysis and presentation.

    ๐Ÿ› ๏ธ How to Apply and Customize Labels in ArcGIS Earth:

    1๏ธโƒฃ Enable Labels for Your Data ๐Ÿ“๐Ÿ”ค Right-click a supported layer in the Table of Contents, select Labeling, and click Enable Labeling to turn on visibility. KML users can now label lines and polygons with a simple toggle switch in the Layer Properties window.

    2๏ธโƒฃ Configure Label Properties for Clarity ๐ŸŽ›๏ธ In the Labeling Properties window, choose which attribute field to display, control placement relative to features, and prioritize key labels for better readability.

    3๏ธโƒฃ Customize Label Appearance for Better Readability ๐ŸŽจ Adjust font, size, color, halo, and background transparency to ensure labels clear over different basemaps and terrain.

    ๐Ÿš€ Pro Tips:

    1๏ธโƒฃ Label KML Lines & Polygons Easily โ€“ No more workarounds! Just use the Label toggle switch in Layer Properties to turn KML labels on/off. 2๏ธโƒฃ Enhance Readability โ€“ Apply halo effects and backgrounds to make labels stand out over complex maps.

    Screenshot of Grantsville, United States, from ArcGIS Earth
    โ†’ 9:24 PM, Feb 26
    Also on Bluesky
  • ๐ŸŒ #ArcGISEarth230Tips | Tip 25: Unlock the Power of Symbology in ArcGIS Earth ๐ŸŽจ๐Ÿ—บ๏ธ

    Did you know?

    ArcGIS Earth provides powerful symbology tools for clearer spatial analysis and data visualization. Whether tracking public health trends, environmental changes, or demographic data, choosing the right symbology enhances insights and decision-makingโ€”in both 2D and 3D.

    ๐Ÿ› ๏ธ How to Apply Symbology in ArcGIS Earth:

    1๏ธโƒฃ Choose the Right Symbology ๐ŸŽ›๏ธ Right-click a feature layer, select Symbology, and pick the method that best represents your data:

    • Single Symbol (Location) โ€“ Apply a uniform symbol to show distribution.
    • Unique Symbol (Type) โ€“ Differentiate features based on attribute values (e.g., land use types).
    • Graduated Colors (Counts & Amounts) โ€“ Use a color ramp to represent quantitative variations (e.g., population density).
    • Dictionary Symbology โ€“ Apply standardized symbols like MIL-STD-2525 and NATO APP-6 for defense and emergency response.

    2๏ธโƒฃ Customize Symbols for Enhanced Visualization ๐ŸŽจ Modify color, transparency, classification, and stroke properties to refine your mapโ€™s clarity. Adjust symbol size and style to highlight key insights.

    3๏ธโƒฃ Use 3D Symbol Extrusion for Deeper Analysis ๐Ÿ“Š Extrude points, lines, or polygons to represent numerical attributes in 3D, making spatial relationships more apparent. This technique is ideal for tracking pandemic cases, visualizing urban expansion, or modeling elevation changes.

    ๐Ÿš€ Pro Tips:

    1๏ธโƒฃ Track Changes Over Time โ€“ Use graduated colors and 3D extrusion to visualize trends such as COVID-19 spread, pollution levels, or deforestation rates. 2๏ธโƒฃ Standardize Symbology for Interoperability โ€“ Use Dictionary Symbology to ensure consistent representation across defense, emergency response, and security operations. 3๏ธโƒฃ Create Custom Symbology โ€“ Import mobile style files (.stylx) to define unique symbology styles that fit your organizationโ€™s needs.

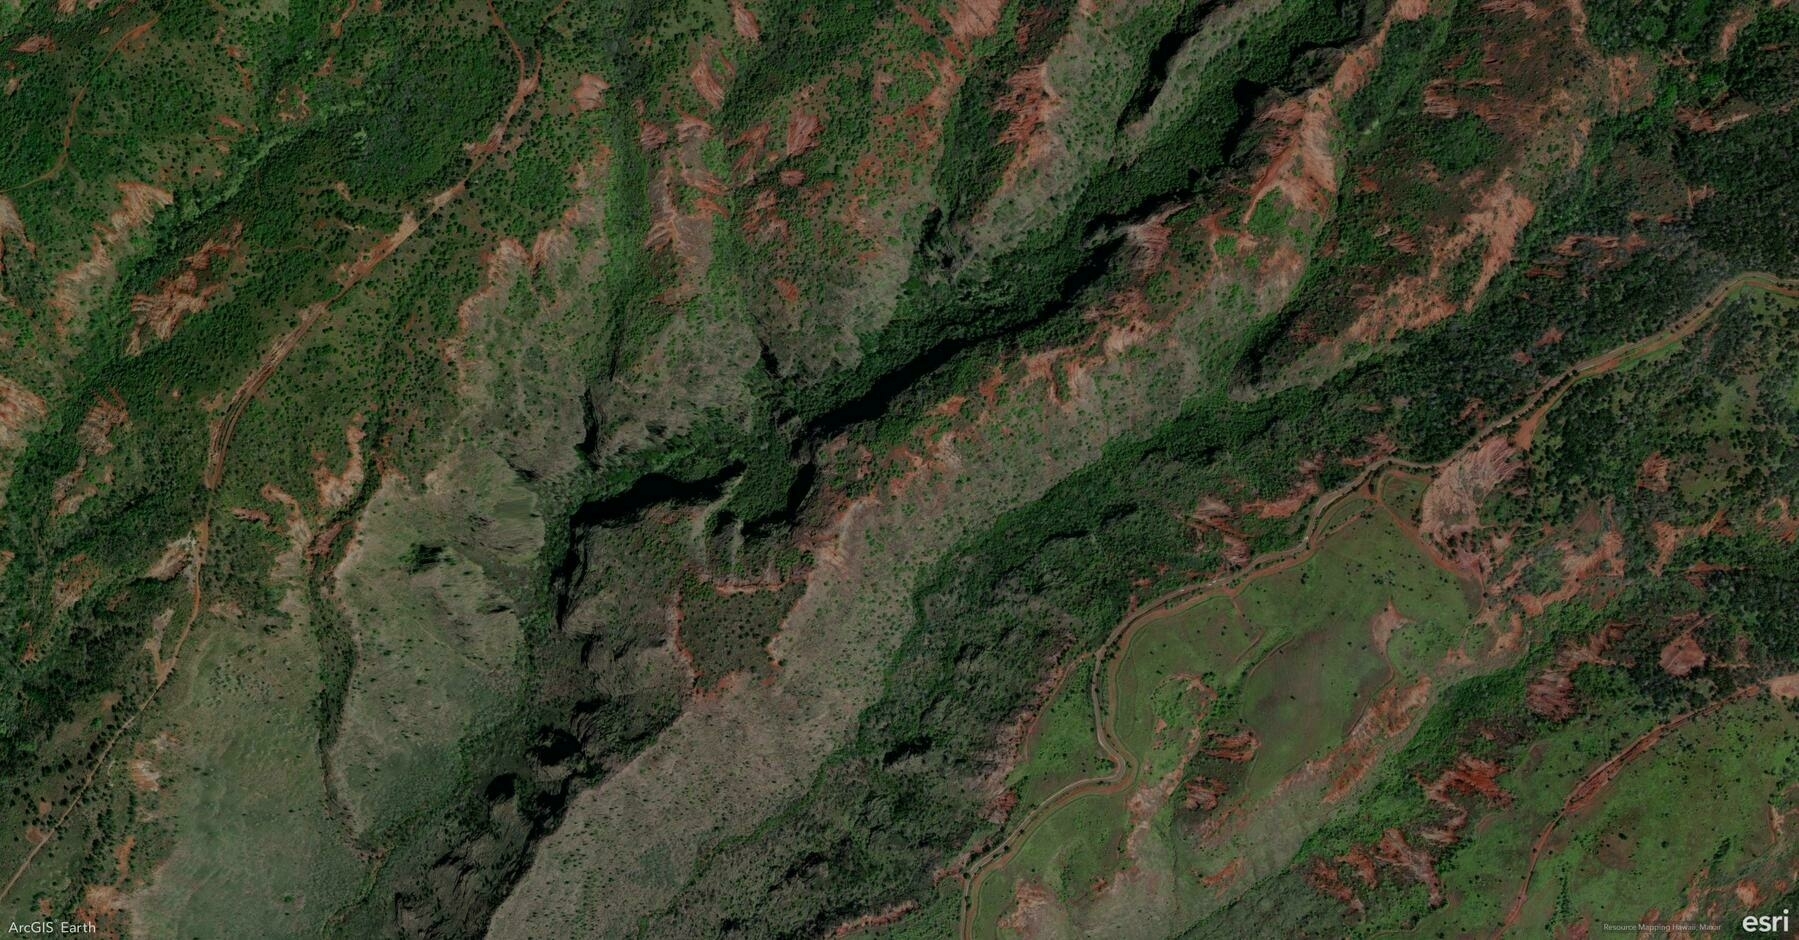
    Screenshot of Kekaha, United States, from ArcGIS Earth
    โ†’ 9:04 PM, Feb 25
    Also on Bluesky
  • ๐ŸŒ #ArcGISEarth230Tips | Tip 24: Boost Efficiency with ArcGIS Earth Administrator Configuration โš™๏ธ๐Ÿ”ง

    Did you know?

    ArcGIS Earth allows administrators to customize and share configuration settings, providing users with a predefined GIS environment that eliminates manual setup. By modifying the config.xml file, admins can preset portal connections, basemaps, GIS services, authentication settings, and UI preferences, reducing setup time and enhancing workflow efficiency across teams.

    ๐Ÿ› ๏ธ How to Configure and Deploy Custom Settings in ArcGIS Earth:

    1๏ธโƒฃ Customize Configuration Files for a Tailored Experience ๐Ÿ› ๏ธ๐Ÿ“‚ Edit the config.xml file (located in C:\Program Files\ArcGIS\Earth\bin\config.xml) to: โœ”๏ธ Preload ArcGIS Online and ArcGIS Enterprise portals. โœ”๏ธ Set startup layers, basemaps, and elevation services for consistency. โœ”๏ธ Customize startup behavior, UI preferences, and security settings to align with organizational needs.

    2๏ธโƒฃ Share Custom Configurations Across Your Organization ๐Ÿ”—๐Ÿ“ค After modifying config.xml, deploy it across your organization by replacing the default configuration during installation. This ensures users can immediately access predefined services, layers, and settings without additional setup.

    3๏ธโƒฃ Optimize the User Experience for Faster Adoption ๐Ÿš€๐Ÿ“Š By providing a preconfigured ArcGIS Earth environment, administrators help users focus on GIS tasks rather than setup, flattening the learning curve and streamlining workflows.

    ๐Ÿš€ Pro Tips:

    1๏ธโƒฃ Standardize Portal Access โ€“ Preload ArcGIS Online & Enterprise connections to ensure seamless integration. 2๏ธโƒฃ Preconfigure Workspaces โ€“ Define basemaps, layers, and datasets to maintain organizational consistency. 3๏ธโƒฃ Customize UI Elements โ€“ Modify banner messages, feedback links, and acknowledgment text to align with your organizationโ€™s branding.

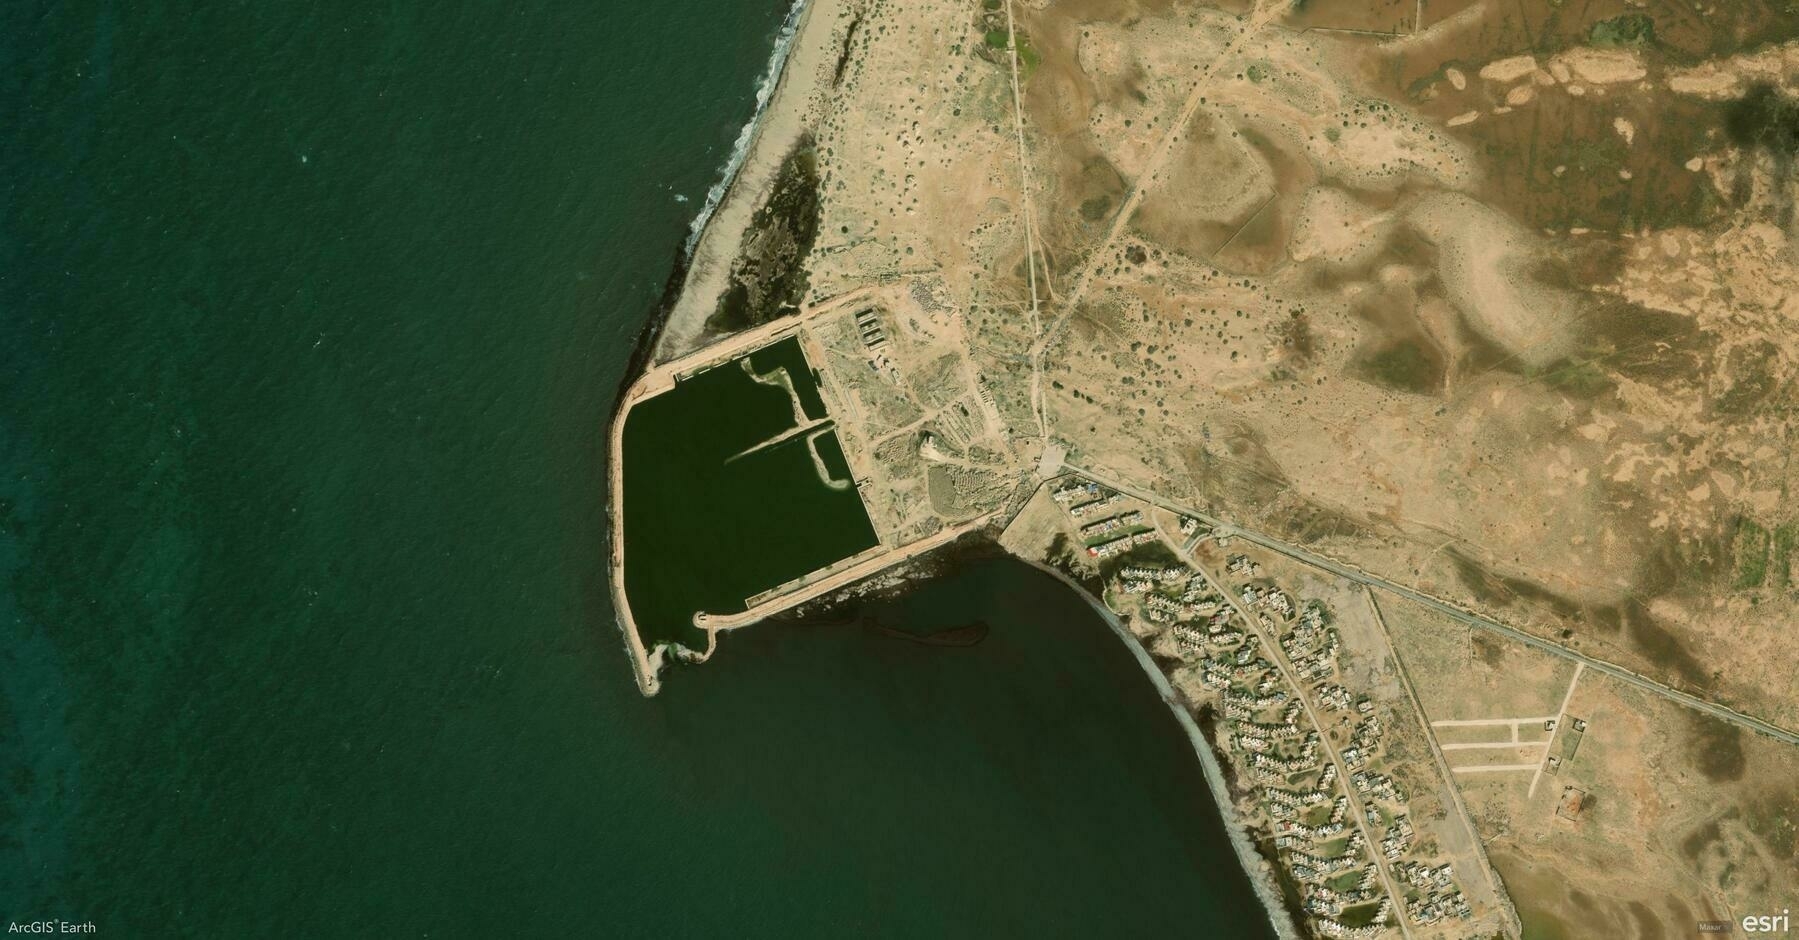
    Screenshot of Libya, from ArcGIS Earth
    โ†’ 9:09 PM, Feb 24
    Also on Bluesky
  • ๐ŸŒ #ArcGISEarth230Tips | Tip 23: Automate ArcGIS Earth with the Automation API ๐Ÿค–โš™๏ธ

    Did you know?

    The ArcGIS Earth Automation API enables seamless app-to-app communication, allowing third-party applications to control navigation, automate tasks, and manage workflows. Introduced in ArcGIS Earth 1.6 and enhanced with a RESTful API in ArcGIS Earth 1.11, this API provides a fast, reliable, and extensible way to integrate ArcGIS Earth into enterprise GIS systems.

    ๐Ÿ› ๏ธ How to Use ArcGIS Earth Automation API:

    1๏ธโƒฃ Enable and Configure the API โš™๏ธ๐Ÿ“ก Activate the Automation API in Advanced Application Settings or configure it via the settings.json file. Adjust autoStart and baseUrl parameters to allow local or remote connections.

    2๏ธโƒฃ Control Navigation and Data Operations ๐ŸŒ๐Ÿ“‚ Use the API to set camera positions, automate fly-through navigation, and load KML, KMZ, and WMS/WMTS layers. Manage workspaces dynamically by adding, updating, or removing layers via automation scripts.

    3๏ธโƒฃ Extend GIS Workflows with REST API Integration ๐Ÿ”—๐Ÿš€ Integrate ArcGIS Earth with enterprise GIS platforms, web applications, or custom .NET extensions. Synchronize 3D scene views with ArcGIS Pro, capture snapshots, and enhance cross-application interactions.

    ๐Ÿš€ Pro Tips:

    1๏ธโƒฃ Automate 3D Navigation โ€“ Use camera positioning and fly-through animations to create smooth GIS presentations. 2๏ธโƒฃ Synchronize with ArcGIS Pro โ€“ Connect scene views between ArcGIS Earth and ArcGIS Pro for real-time geospatial analysis. 3๏ธโƒฃ Use Ready-to-Use Samples โ€“ Access the sample page in Advanced Application Settings to explore the API. Check ArcGIS Earth Automation API GitHub repository for integration samples.

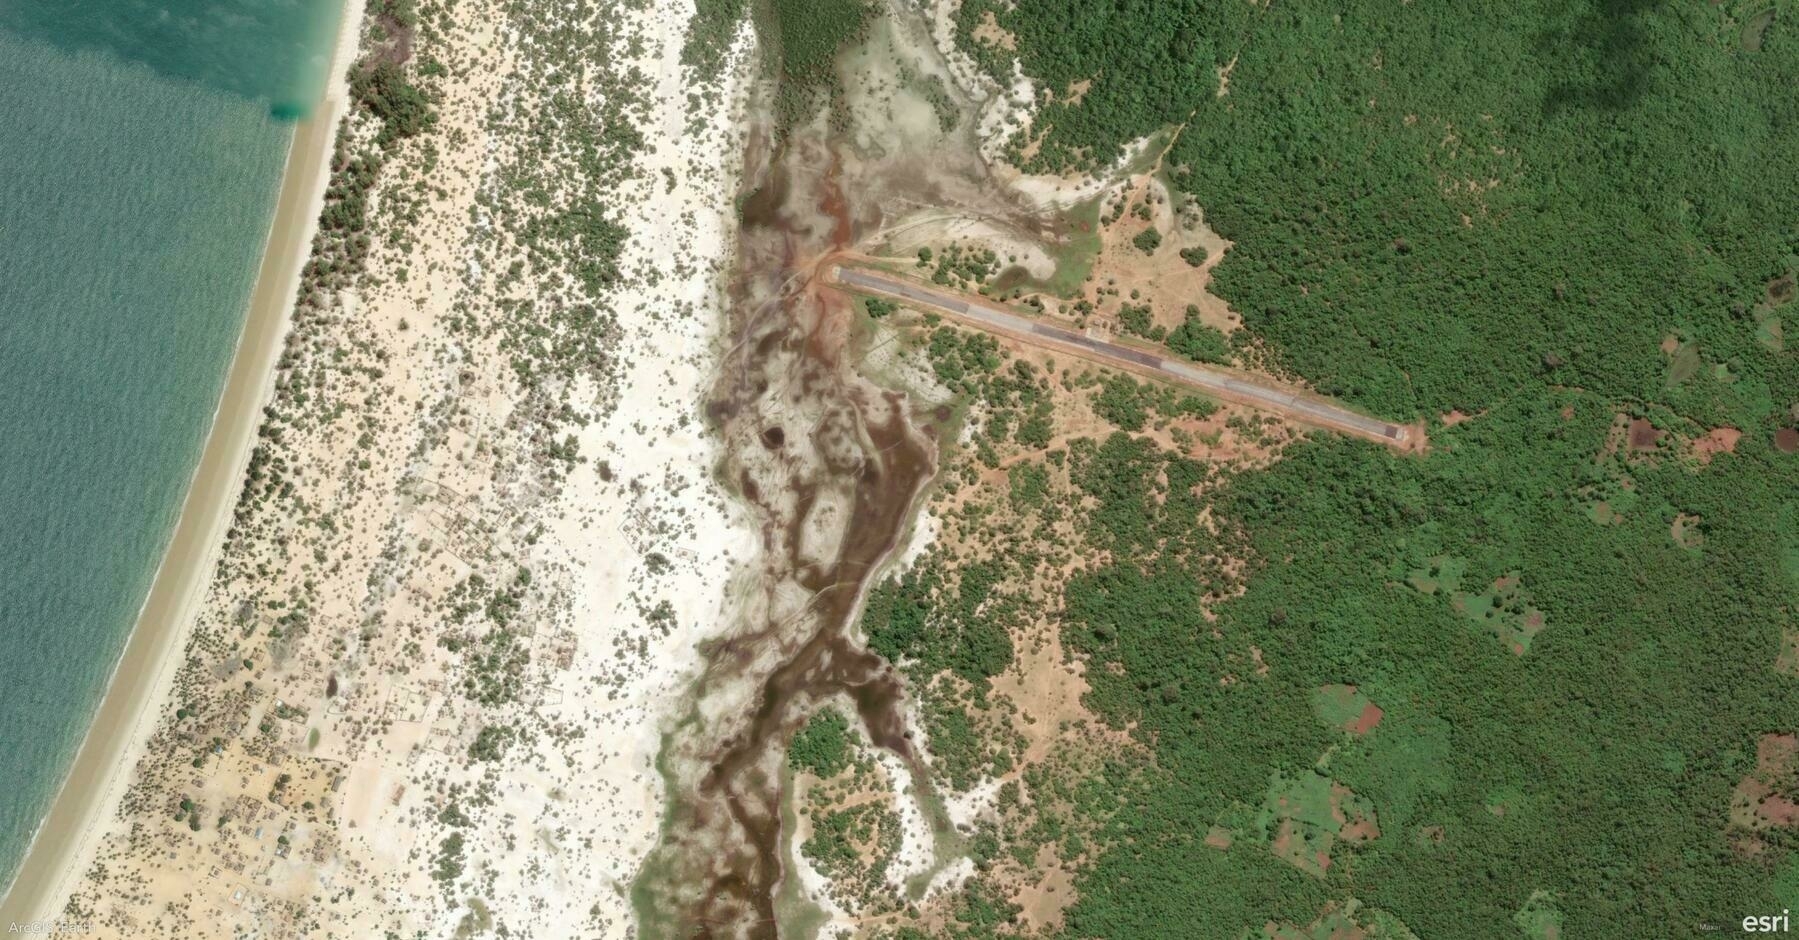
    Screenshot of District d'Analalava, Madagascar, from ArcGIS Earth
    โ†’ 10:16 PM, Feb 21
    Also on Bluesky
  • ๐ŸŒ #ArcGISEarth230Tips | Tip 22: Take 3D GIS Anywhere with ArcGIS Earth Mobile ๐Ÿ“ฑ๐ŸŒŽ

    Did you know?

    ArcGIS Earth Mobile launched in September 2019, bringing powerful 3D GIS visualization and field mapping to iOS and Android. Whether you’re exploring 3D maps, performing interactive analysis, or recording GPS tracks, ArcGIS Earth Mobile provides seamless access to geospatial dataโ€”online or offline.

    ๐Ÿ› ๏ธ How to Use ArcGIS Earth Mobile for Field Operations:

    1๏ธโƒฃ Access 2D & 3D Content from Anywhere ๐ŸŒ๐Ÿ“‚ Connect to ArcGIS Online, ArcGIS Enterprise, or load local datasets to explore terrain, vector layers, and 3D content in real time.

    2๏ธโƒฃ Capture and Share Field Observations โœ๏ธ๐Ÿ“Œ Create points, lines, and polygons, annotate maps with drawings, labels, and geotagged photos, and export findings as KMZ files for easy sharing and GIS integration.

    3๏ธโƒฃ Record GPS Tracks and Conduct 3D Analysis ๐Ÿ“๐Ÿ“Š Enable GPS tracking to log movement paths, generate location-based tours, and perform interactive 3D analysis for deeper spatial insights.

    ๐Ÿš€ Pro Tips:

    1๏ธโƒฃ Go Offline with Preloaded Maps โ€“ Download KML files and 3D scene data for uninterrupted access in disconnected environments. 2๏ธโƒฃ Create and Share Tours โ€“ Combine GPS tracks, drawings, and geotagged images for immersive storytelling. 3๏ธโƒฃ Enhance Navigation โ€“ Use tap-to-identify, geolocation tools, and search functionality for quick access to critical data.

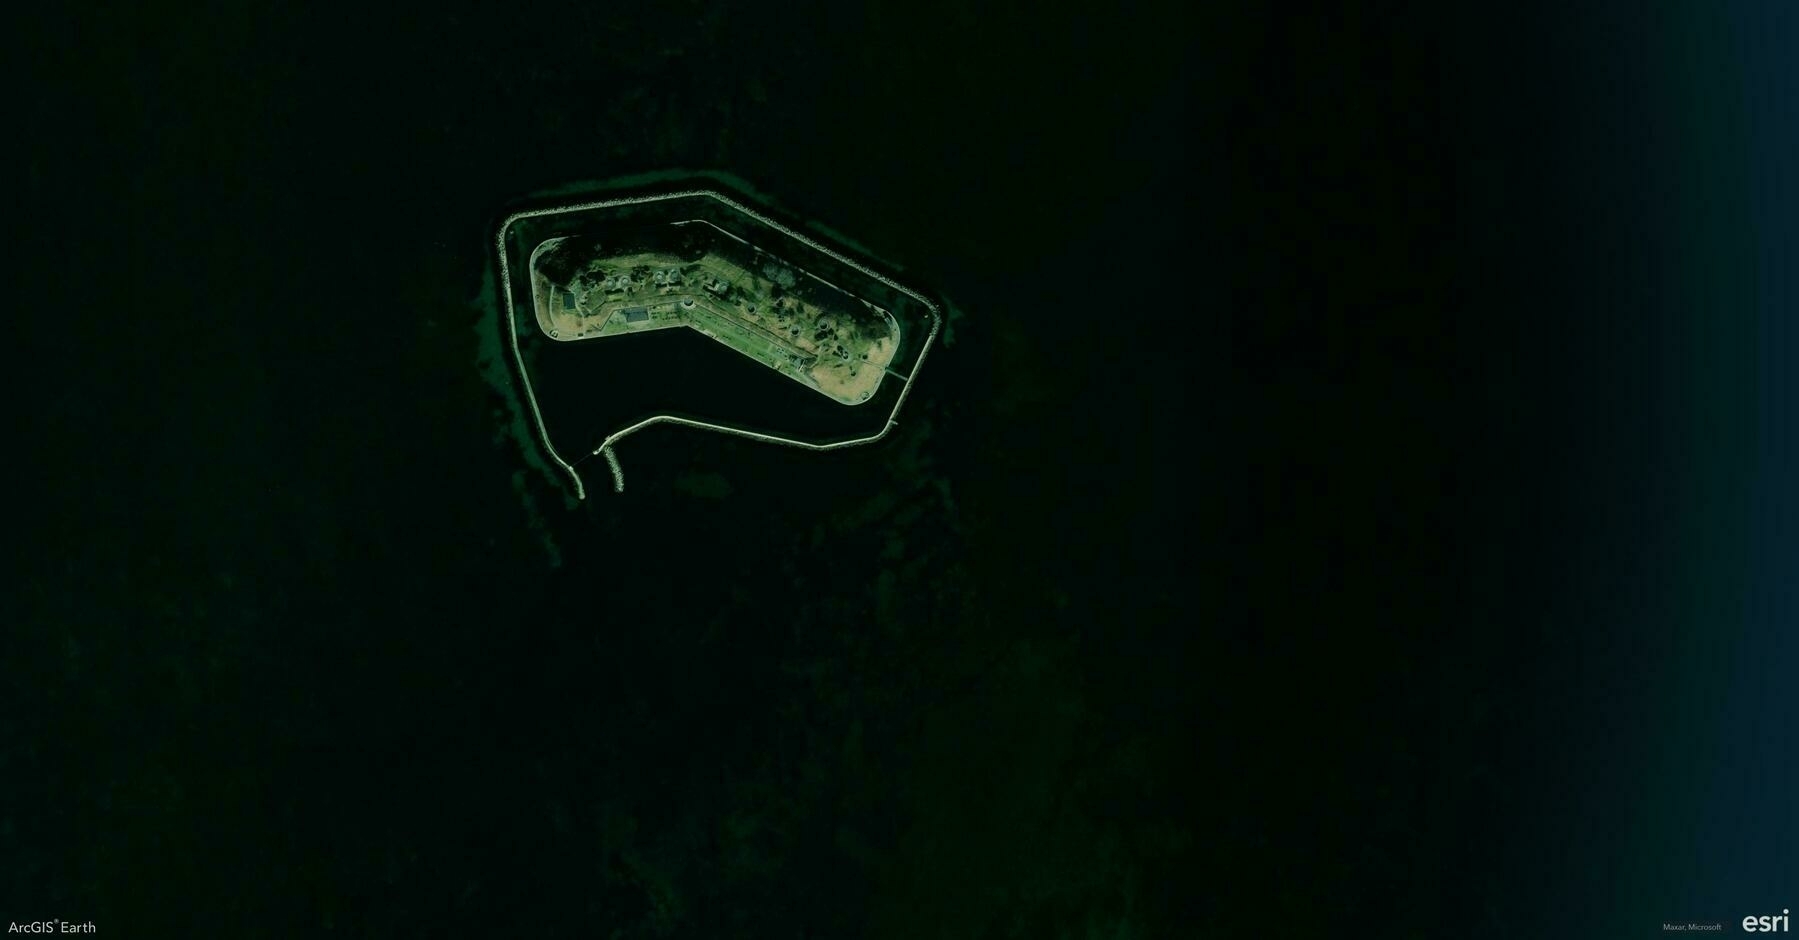
    Screenshot of Kastrup, Denmark, from ArcGIS Earth
    โ†’ 9:43 PM, Feb 20
    Also on Bluesky
  • ๐ŸŒ #ArcGISEarth230Tips | Tip 21: Save and Share Your Work with ArcGIS Earth Workspaces ๐Ÿ—‚๏ธ๐Ÿ’พ

    Did you know?

    ArcGIS Earthโ€™s Workspace feature allows you to save, restore, and share your entire mapping environment, ensuring seamless continuity between sessions. By preserving basemaps, terrain layers, operational data, bookmarks, and custom settings, Workspaces streamline project management and enhance collaboration across teams.

    ๐Ÿ› ๏ธ How to Use Workspaces in ArcGIS Earth:

    1๏ธโƒฃ Save and Restore Your Workspace ๐Ÿ’พ๐Ÿ”„ Keep your work organized by saving a Workspace directory, which stores your active layers, bookmarks, basemap settings, and movie tracks. Enable Autosave to automatically update your progress and prevent data loss.

    2๏ธโƒฃ Import, Export, and Share Workspaces ๐Ÿ“ค๐Ÿ“‚ Use the Import Workspace option to load a previously saved workspace or Export Workspace to share it with colleagues. This is especially useful when working on ongoing projects or collaborative mapping efforts.

    3๏ธโƒฃ Manage and Customize Your Workspace Settings โš™๏ธ๐Ÿ”ง Reset a workspace to start fresh, clear all content, or revert to default settings as needed. Workspaces are stored in Documents by default, but you can set a custom directory for better organization.

    ๐Ÿš€ Pro Tips:

    1๏ธโƒฃ Use Shared Workspaces โ€“ Export workspaces to a shared directory so teams can collaborate seamlessly. 2๏ธโƒฃ Keep Multiple Workspaces โ€“ Save different Workspaces for various projects, regions, or analysis types to streamline workflow switching. 3๏ธโƒฃ Optimize for Version Compatibility โ€“ Workspaces from older versions of ArcGIS Earth may not be fully supported in the latest release.

    Screenshot of Paia, United States, from ArcGIS Earth
    โ†’ 8:55 PM, Feb 19
    Also on Bluesky
  • ๐ŸŒ #ArcGISEarth230Tips | Tip 20: Navigate and Record Your Path with Real-Time GNSS ๐Ÿ“๐Ÿ›ฐ๏ธ

    Did you know?

    ArcGIS Earth supports real-time GNSS (Global Navigation Satellite System) integration, allowing you to track your live location, record movement paths, and capture high-accuracy observation points in a 3D environment. Whether for field data collection, navigation, or situational awareness, GNSS ensures precise positioningโ€”even in disconnected environments.

    ๐Ÿ› ๏ธ How to Use Real-Time GNSS in ArcGIS Earth:

    1๏ธโƒฃ Connect to a GNSS Receiver for Live Tracking ๐Ÿ“ก๐Ÿ“ ArcGIS Earth supports built-in GPS sensors and external GNSS receivers using the NMEA messaging protocol. Connect your device via USB, Bluetooth, or a virtual COM port, then activate Real-Time GNSS to display your live location in the scene.

    2๏ธโƒฃ Visualize and Record GNSS Movement in 3D ๐ŸŒŽ๐Ÿšถโ€โ™‚๏ธ Once connected, ArcGIS Earth can zoom to your location, show altitude, accuracy, and satellite signals, and record movement in real-time. You can log positions as observation points or track movements over time to analyze routes and playback past paths.

    3๏ธโƒฃ Import, Export, and Share GNSS Data ๐Ÿ“ฅ๐Ÿ“ค Review historical movements by importing NMEA files, then replay the recorded track in ArcGIS Earth. Export GNSS observations and tracks as KML files or share them to your organizationโ€™s GIS portal for further analysis and collaboration.

    ๐Ÿš€ Pro Tips:

    1๏ธโƒฃ Customize Location Display โ€“ Enable speed, altitude, and positional accuracy for real-time situational awareness. 2๏ธโƒฃ Optimize Fieldwork โ€“ Combine offline basemaps with GNSS tracking to ensure seamless navigation in remote areas. 3๏ธโƒฃ Analyze Past Movements โ€“ Replay recorded tracks or import NMEA logs to review field activities and historical routes.

    Screenshot of Santa Fe, United States, from ArcGIS Earth
    โ†’ 9:20 PM, Feb 18
    Also on Bluesky
  • ๐ŸŒ #ArcGISEarth230Tips | Tip 19: Bring Your Maps to Life with ArcGIS Earth Movie ๐ŸŽฅ๐ŸŒŽ

    Did you know?

    ArcGIS Earthโ€™s Movie Tool lets you create professional-quality animated videos using geospatial data, camera effects, and environmental settings. With an intuitive interface and advanced editing tools, ArcGIS Earth Movie turns GIS storytelling into a seamless experience, whether you’re showcasing urban development, environmental changes, or GIS analysis.

    ๐Ÿ› ๏ธ How to Create a Movie in ArcGIS Earth:

    1๏ธโƒฃ Capture Key Scenes for Your Movie ๐ŸŽฌ๐Ÿ“Œ Use Bookmarks or manually navigate to define keyframes in your animation. Choose from Fly-To, Rotate, or Zoom effects to control the camera motion, ensuring smooth scene transitions.

    2๏ธโƒฃ Customize Animation and Effects ๐ŸŽž๏ธโœจ Enhance your movie by adding daylight changes, underground views, basemaps, elevation exaggeration, and markers. Adjust speed, transitions, and camera paths to create professional-quality animations.

    3๏ธโƒฃ Export High-Quality Videos for Sharing ๐Ÿ“ค๐Ÿš€ Once finalized, export your ArcGIS Earth movie as a high-quality video file. Share it with stakeholders, decision-makers, or the public to communicate geographic insights effectively.

    ๐Ÿš€ Pro Tips:

    1๏ธโƒฃ Use dynamic markers (GIFs, videos, and billboards) to make your scenes more engaging. 2๏ธโƒฃ Enhance storytelling with in-app voice-over recording for real-time narration. 3๏ธโƒฃ optimize export time and video clarity from Efficiency, Balanced, or Quality modes.

    Screenshot of Vrataruลกa, Croatia, from ArcGIS Earth
    โ†’ 9:03 PM, Feb 17
    Also on Bluesky
← Newer Posts Page 3 of 5 Older Posts →
  • RSS
  • JSON Feed
  • Lucky
  • Archive
  • About