Puran
TIL Photos Reading Weekly Current Shelf Search Stats
  • 🌍 #ArcGISEarth230Tips | Tip 18: Seamlessly Integrate ArcGIS Earth with App Links 🔗📍

    Did you know?

    ArcGIS Earth supports App Links, allowing you to launch the app from a hyperlink, web service, or external application. You can open specific locations, web services, or portal items instantly, making App Links a powerful tool for field operations, GIS dashboards, and collaboration across desktop and mobile platforms.

    🛠️ How to Use App Links in ArcGIS Earth:

    1️⃣ Open ArcGIS Earth with a Custom URL 🌍🔗 Launch ArcGIS Earth directly using earth.arcgis.app on Windows, Android, or iOS. Customize the URL with parameters to open predefined locations, adjust viewpoints, and set camera angles.

    2️⃣ Automate Workflows with Deep Linking ⚙️🚀 Integrate ArcGIS Earth with GIS platforms, field applications, and enterprise systems by embedding App Links in dashboards, reports, and web services. Configure links to load specific portal items, tile services, or hosted layers instantly.

    3️⃣ Share Direct Links for Collaboration 📤👥 Generate and share App Links to ensure consistent navigation and scene views across teams. Embed links in GIS applications, internal portals, or fieldwork reports to provide quick access to key locations and datasets.

    🚀 Pro Tips:

    1️⃣ Embed App Links in reports, dashboards, and mobile apps for one-click access. 2️⃣ Use Encoded URLs to ensure compatibility across different platforms and systems.
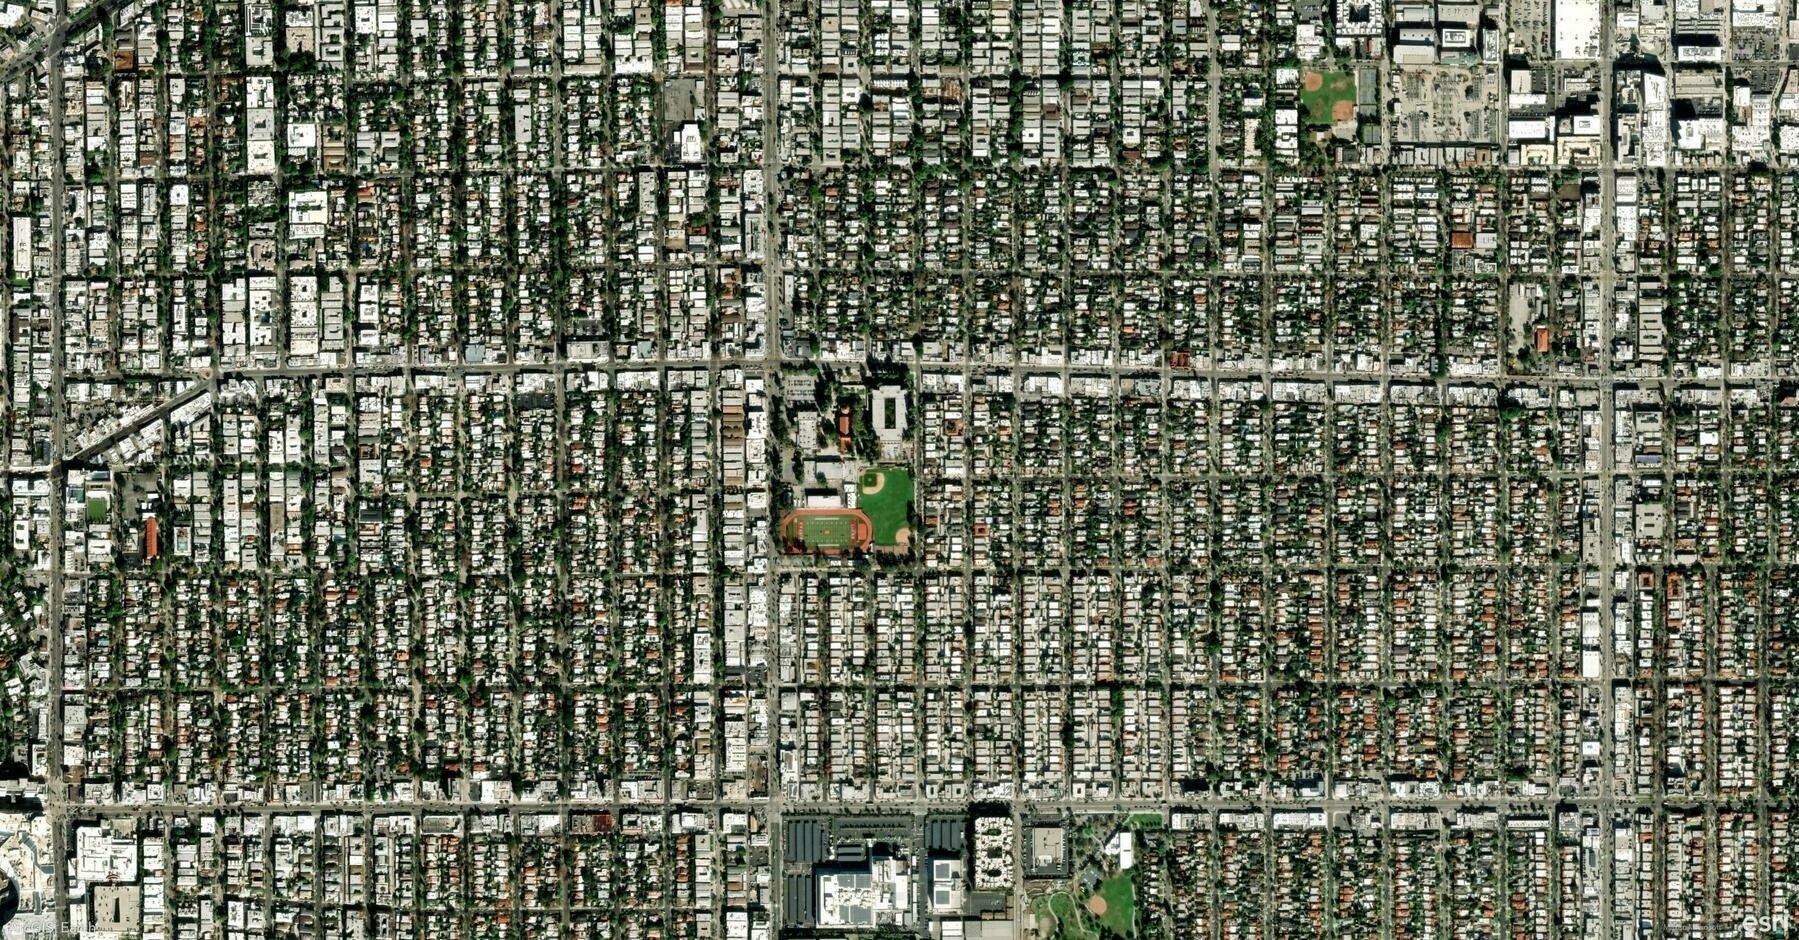
    Screenshot of Los Angeles, United States, from ArcGIS Earth
    → 11:57 PM, Feb 14
    Also on Bluesky
  • 🌍 #ArcGISEarth230Tips | Tip 17: Download Map Tiles for Offline Access 🗺️📥

    Did you know?

    ArcGIS Earth allows you to download web tile and vector tile layers for offline use, ensuring uninterrupted access to basemaps and operational layers even in remote locations. This feature is essential for fieldwork, disaster response, and mobile GIS workflows, allowing users to work without an internet connection.

    🛠️ How to Download Map Tiles for Offline Use:

    1️⃣ Choose a Tile Layer for Offline Use 🌍📌 Ensure the web tile or vector tile layer supports tile export before downloading. Only layers configured for offline use can be taken offline.

    2️⃣ Define the Download Area and Zoom Level 🎯📏 Select the target layer, then specify the extent by dragging the handles on the map or manually entering coordinates. Adjust the Max Download Level to control the resolution and file size—higher levels provide more detail but require more storage.

    3️⃣ Download and Use Offline 📥🚀 Set the download path and click Download Map Tiles to save the layer. Enable Auto Add to TOC Once Exported to have the tiles automatically appear in the Table of Contents for easy access. Once downloaded, the tiles will be used automatically when offline.

    🚀 Pro Tips:

    1️⃣ Plan Ahead – Download tiles before going offline to ensure uninterrupted access in remote locations. 2️⃣ Balance Detail & Storage – Choose an appropriate Max Download Level to avoid excessive file sizes. 3️⃣ Work Seamlessly with GPS – Combine offline maps with GPS tracking to enhance field navigation.

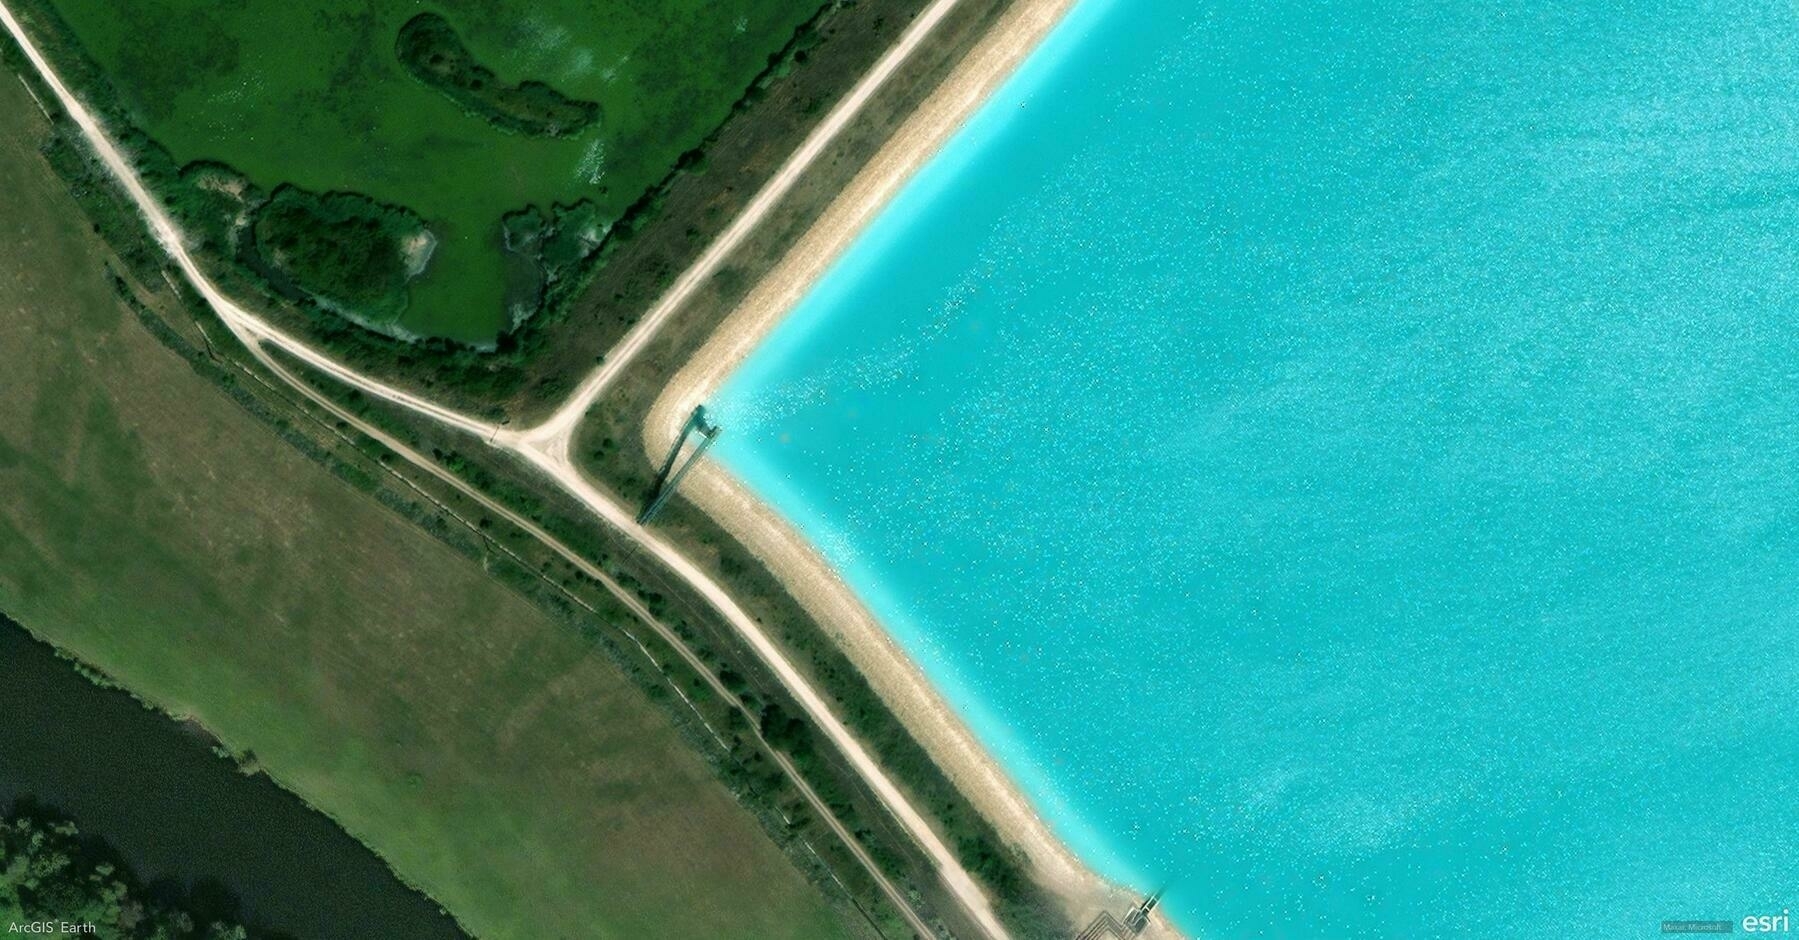
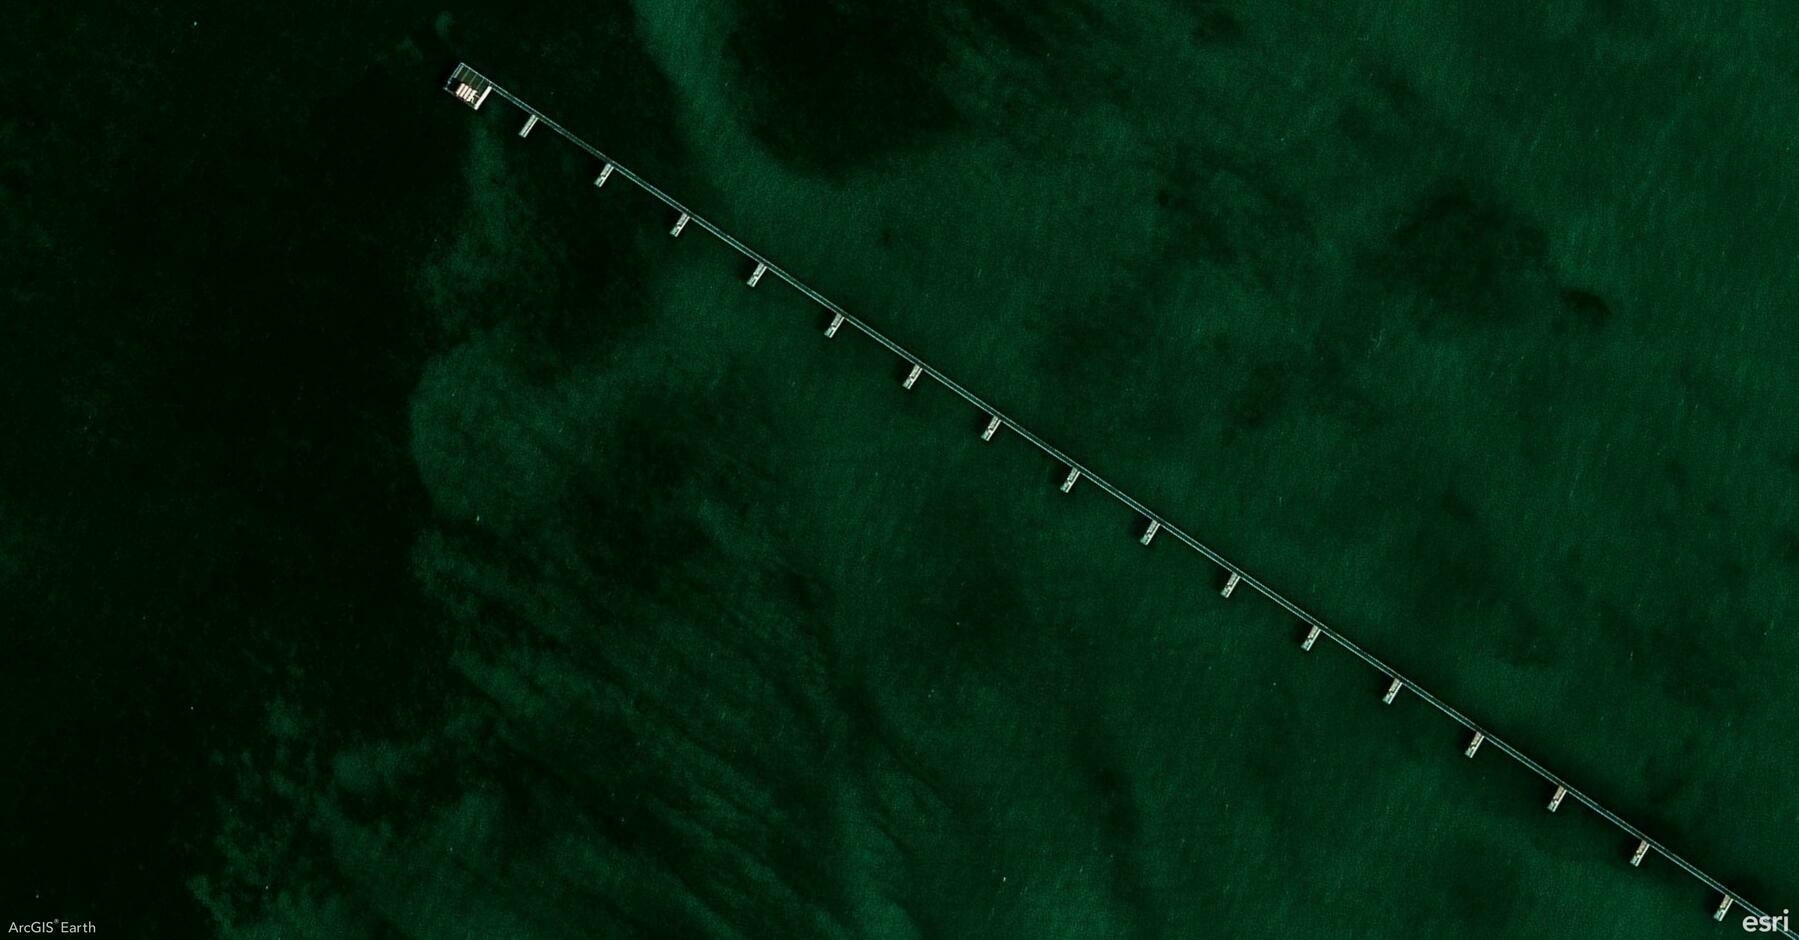
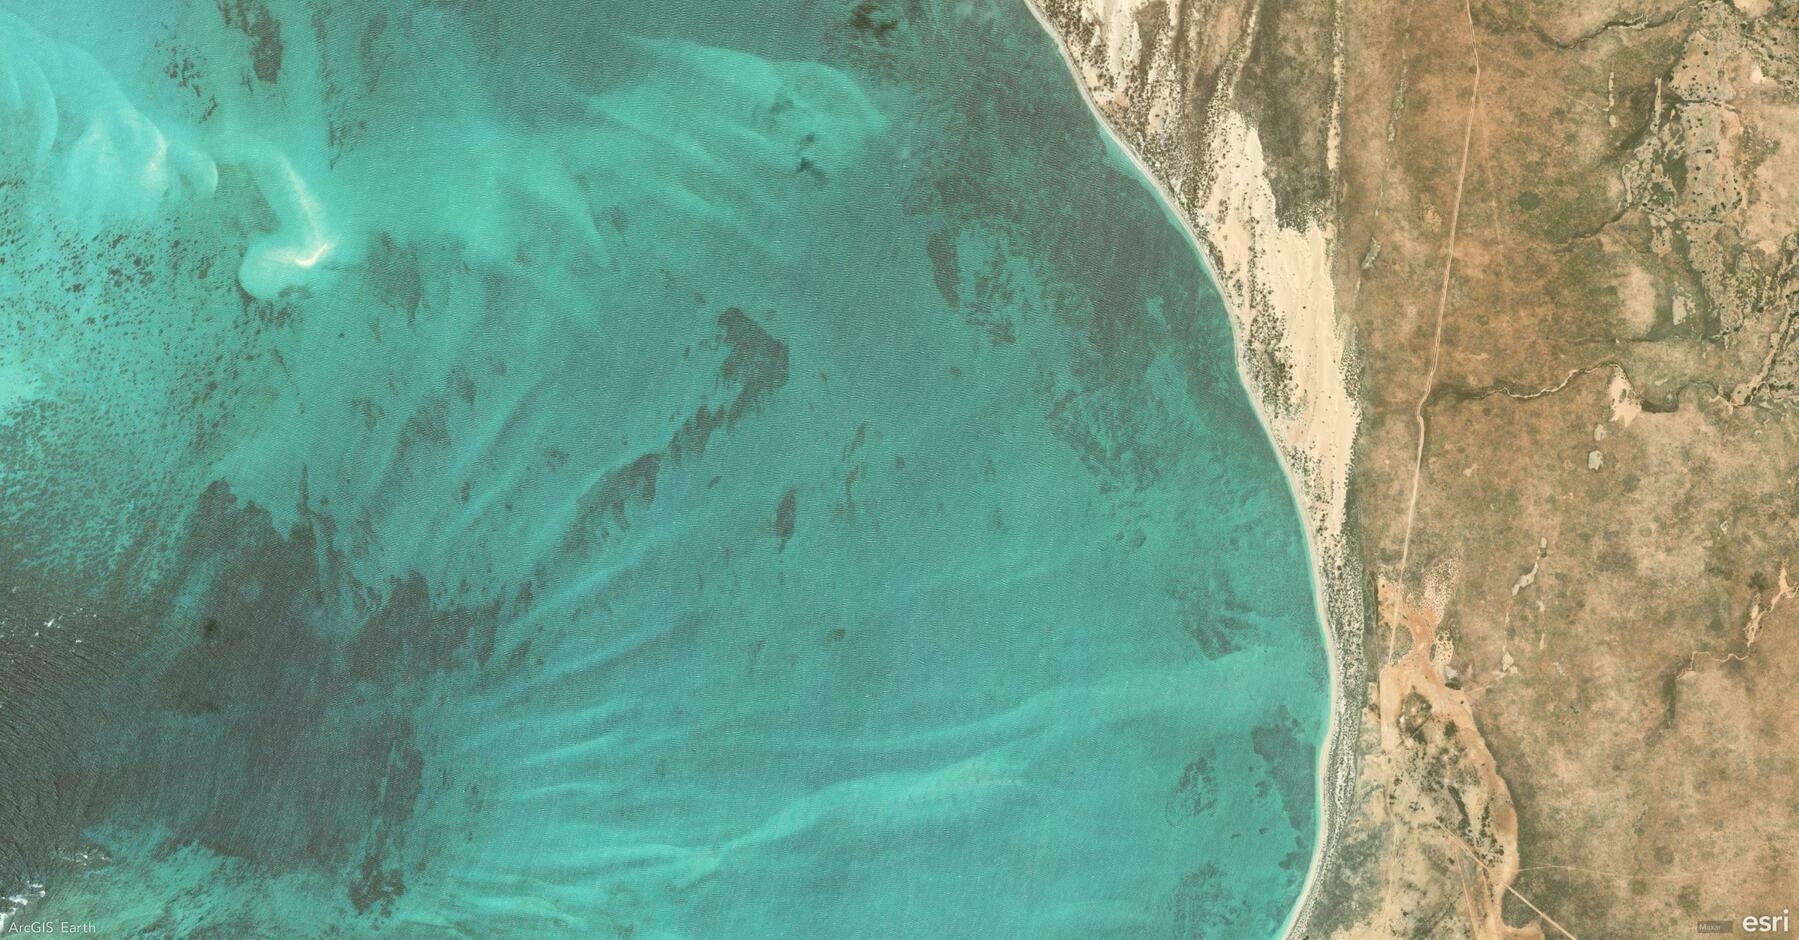
    Screenshot of Ningaloo, Australia, from ArcGIS Earth
    → 7:54 PM, Feb 13
    Also on Bluesky
  • 🌍 #ArcGISEarth230Tips | Tip 16: Seamlessly Integrate ArcGIS Earth with ArcGIS Online & Enterprise 🔗🌐

    Did you know?

    ArcGIS Earth connects directly to ArcGIS Online and ArcGIS Enterprise, giving you seamless access to your organization’s maps, layers, and 3D content. Whether in the field or the office, integrating with your GIS portal streamlines workflows and enhances collaboration.

    🛠️ How to Connect ArcGIS Earth to ArcGIS Online & Enterprise:

    1️⃣ Sign In for Instant Access 🔑🌍 Click Sign In and enter your ArcGIS Online or Enterprise credentials to unlock web maps, feature services, and 3D scene layers—no manual file imports needed.

    2️⃣ Browse and Add Your Organization’s Data 📂🔎 Explore hosted feature layers, tiled basemaps, and 3D scenes from your portal. With just a few clicks, you can integrate authoritative GIS data directly into ArcGIS Earth and visualize it in 3D space.

    3️⃣ Share Your Work Back to the Portal 📤✨ Export projects as KMZ files and upload them to ArcGIS Online or Enterprise, ensuring your team can access the latest updates across ArcGIS Earth, ArcGIS Pro, and Web GIS applications.

    🚀 Pro Tips:

    1️⃣ Choose the Right Authentication – ArcGIS Earth supports multiple authentication options, including Built-in, IWA, PKI, SAML, and Kerberos security. 2️⃣ Manage Multiple Portals – Use Portal Manager to add, switch, or remove ArcGIS Online and ArcGIS Enterprise connections with ease. 3️⃣ Sign In via Web Browser – ArcGIS Earth allows browser-based authentication, providing an alternative to direct login methods for added flexibility.

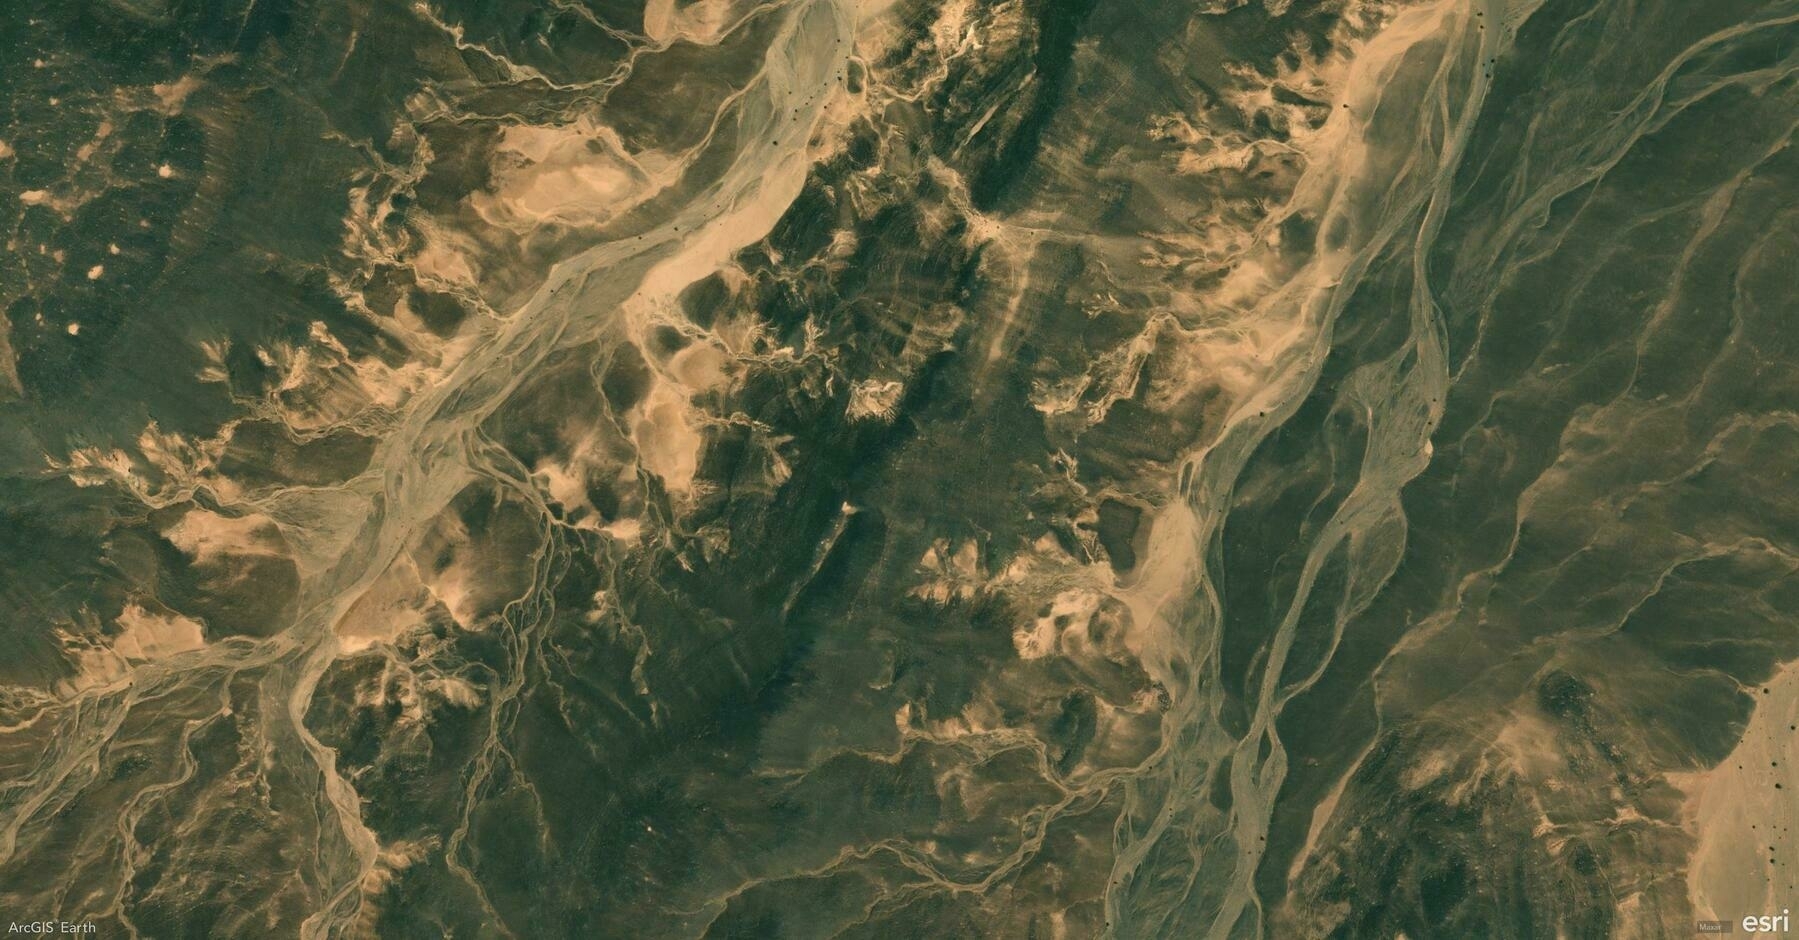
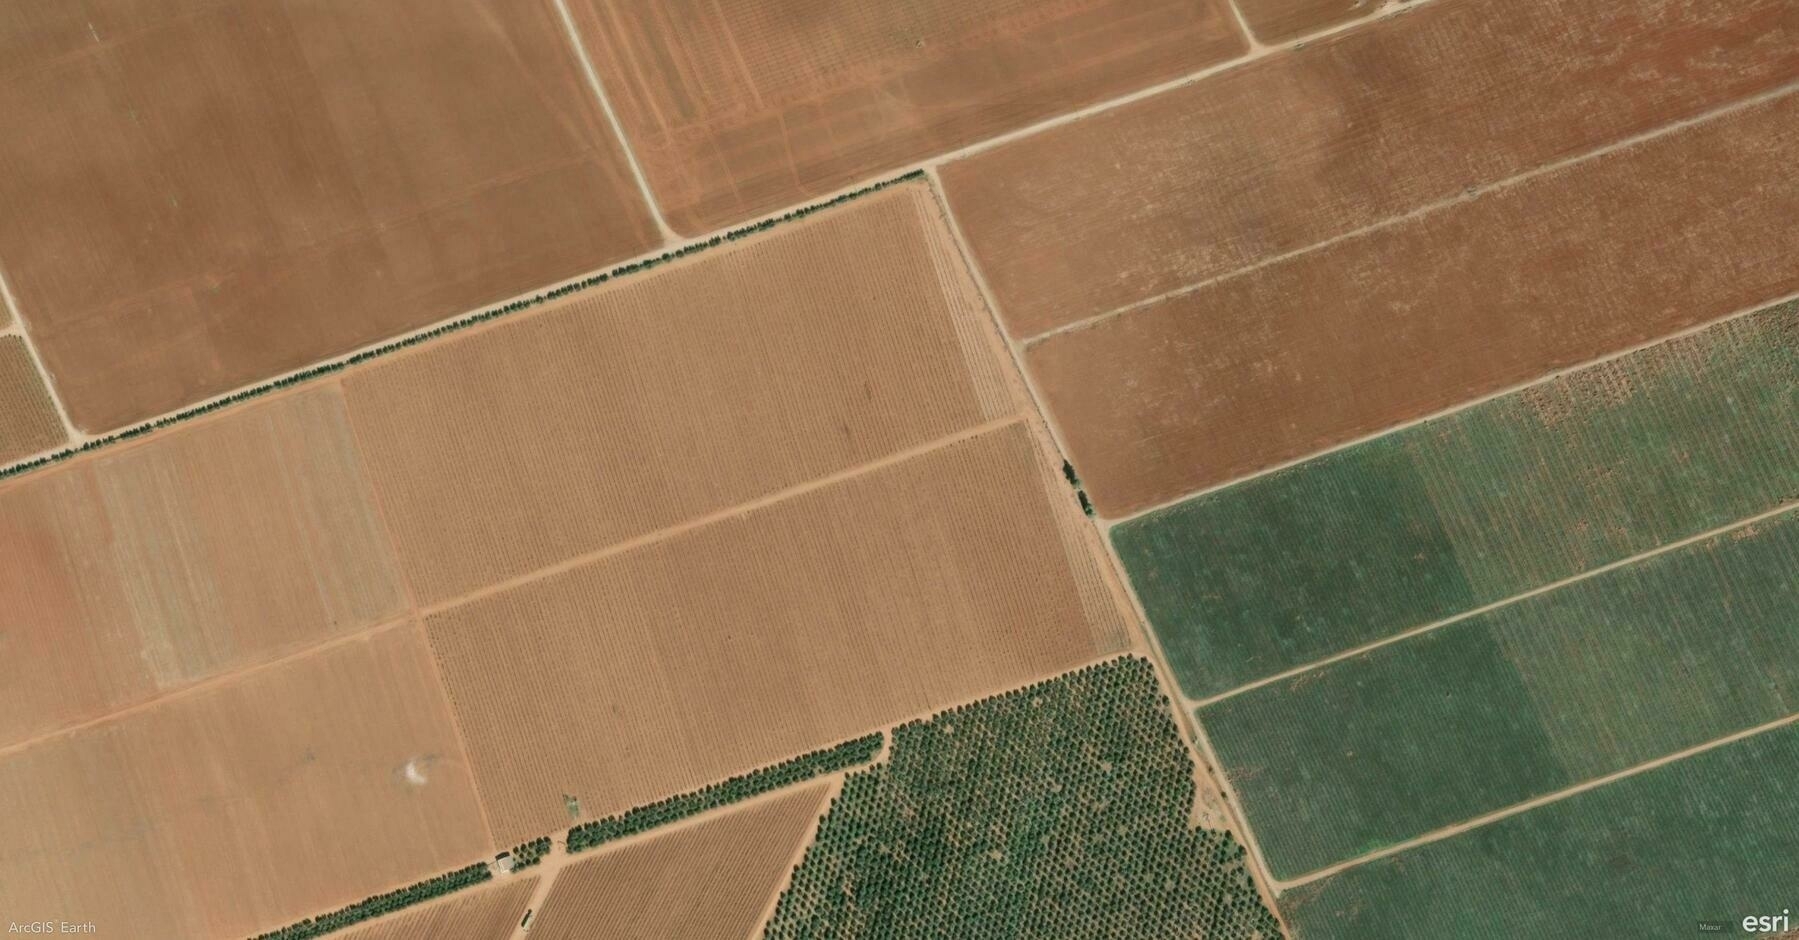
    Screenshot of Jufra District, Libya, from ArcGIS Earth
    → 9:25 PM, Feb 12
    Also on Bluesky
  • 🌍 #ArcGISEarth230Tips | Tip 15: Simulate Sunlight and Shadows with the Daylight Tool ☀️🌎

    Did you know?

    ArcGIS Earth’s Daylight Tool lets you visualize sunlight and shadow movement across any location at different times of the day and year. Whether you’re analyzing building shadows, planning solar energy installations, or assessing seasonal daylight impact, this tool brings a new level of realism and insight to your 3D scene.

    🛠️ How to Use the Daylight Tool for Advanced Analysis:

    1️⃣ Simulate Sunlight at Any Time & Date 🌞⏳ Activate the Daylight Effect and use the time slider or calendar selector to observe how the sun’s position changes throughout the day and across seasons. This is crucial for urban development, solar potential studies, and landscape design.

    2️⃣ Animate Sunlight to Show Changes Over Time 🌅🎥 Enable Animate Sunlight and Shadows to visualize daily or yearly cycles. This helps analyze how shadows shift over time, which is key for protecting parks from high-rise shading, ensuring optimal daylight exposure, and improving building placement.

    3️⃣ Fine-Tune Visibility with Shadows and Time Zones ☁️🕰️ Turn on Show Shadows to understand how terrain and structures interact with sunlight. Adjust the time zone for accurate sun positioning worldwide, ensuring reliable analysis for global projects.

    🚀 Pro Tips:

    1️⃣ Use daylight animation to create seasonal shadow impact studies for urban planning. 2️⃣ Bookmark specific daylight settings to compare sun angles across different seasons. 3️⃣ Adjust atmospheric effects for more realistic lighting and shading.

    Screenshot of No.2 Karmi, India, from ArcGIS Earth
    → 10:36 PM, Feb 11
    Also on Bluesky
  • 🌍 #ArcGISEarth230Tips | Tip 14: Unlock the Hidden World with Underground Mode ⛏️🌎

    Did you know?

    ArcGIS Earth’s Underground Mode allows you to explore and analyze subsurface environments, helping you visualize tunnels, mines, pipelines, and geological formations with ease. Whether for mining safety, utility inspections, or subterranean navigation, this tool provides a new dimension to GIS mapping.

    🛠️ How to Use Underground Mode for Visualization & Analysis:

    1️⃣ Navigate Seamlessly Below the Surface 🔍

    Activate Underground Mode to make the terrain transparent and reveal subsurface features like abandoned mines, underground utilities, and geological structures. Use 3D navigation tools to move through tunnels and passageways as if you were underground.

    2️⃣ Conduct Interactive Subsurface Analysis 👁️

    With tools like Line of Sight, simulate what a miner, engineer, or emergency responder would see within an underground system. Visualizing sightlines in mine shafts, sewer systems, or disaster response zones ensures better situational awareness and safety planning.

    3️⃣ Integrate High-Precision 3D Data for Realism 📡

    Load LIDAR point clouds and 3D scene layers to enhance the accuracy of underground modeling. Detailed underground visualizations assist in mine inspections, structural integrity assessments, and environmental impact evaluations.

    🚀 Pro Tips:

    1️⃣ Adjust Terrain Transparency to balance surface and subsurface visibility.

    2️⃣ Use Elevation Exaggeration to emphasize subtle underground formations.

    3️⃣ Enhance Safety Planning by integrating mine layouts and tunnel blueprints into your scene.

    Screenshot of Laneuveville-devant-Nancy, France, from ArcGIS Earth
    → 10:59 PM, Feb 10
    Also on Bluesky
  • 🌍 #ArcGISEarth230Tips | Tip 13: Export and Share Stunning Map Views 🖼️📤

    Did you know?

    ArcGIS Earth makes it effortless to export and share your current map view as a high-quality image, a professional map layout, or a print-ready file. Whether you’re preparing a presentation, designing a poster, or sharing insights with your team, ArcGIS Earth’s export tools help you deliver visually compelling and informative maps.

    🛠️ How to Export and Share Your Map Views:

    1️⃣ Design a Custom Map Layout 🗺️ Click Export > Create Map Layout to generate a map with your scene view, title, north arrow, and scale bar. Add more context with a legend, descriptive text, images, or dynamic text like scale and coordinates.

    2️⃣ Personalize for Any Purpose ✏️ Adjust the paper size (default A4), orientation (portrait or landscape), and margins. Use Scene Only for a minimalist view or add visual elements for more context. Double-click the scene to zoom, pan, and rotate for the perfect angle.

    3️⃣ Export, Email, or Print Instantly 📤 Once complete, choose to: Export as Image for reports or presentations. Email the current view directly as an attachment. Print for meetings, displays, or field use.

    🚀 Pro Tips:

    1️⃣ Custom Branding: Insert local images or your company logo for a branded, professional touch.

    2️⃣ Fine-Tune Your View: Double-click the scene in the layout to adjust the camera view before exporting.

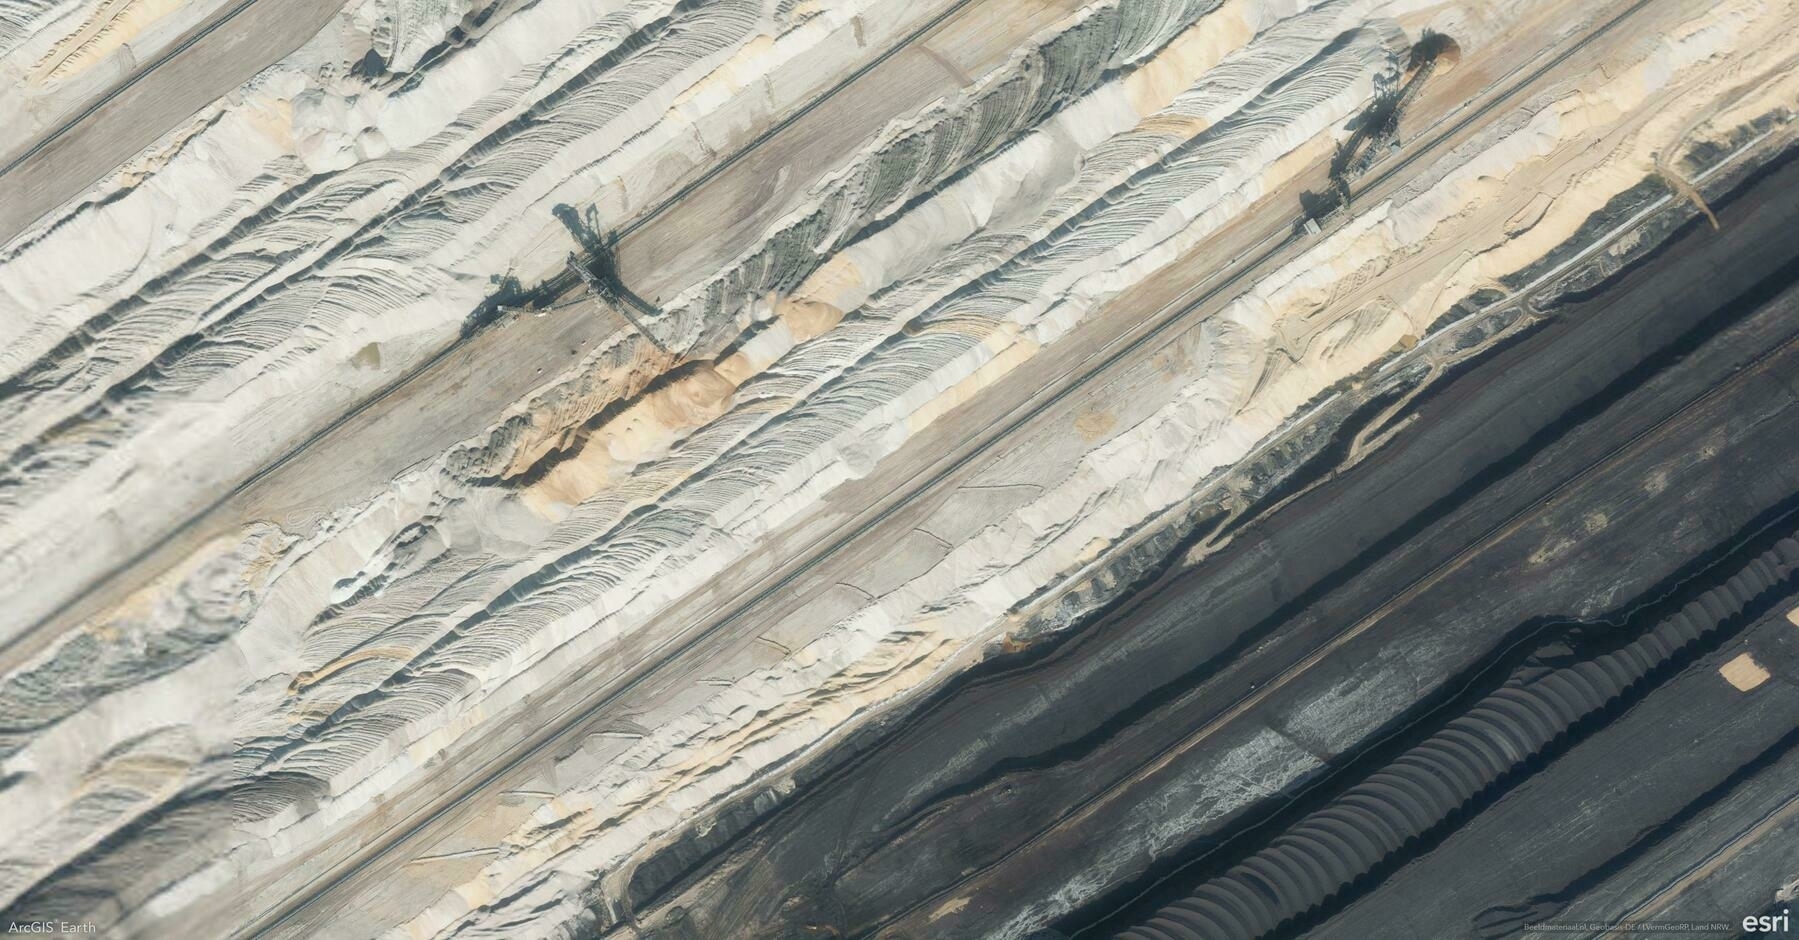
    Screenshot of Elsdorf, Germany, from ArcGIS Earth
    → 10:23 PM, Jan 17
    Also on Bluesky
  • 🌍 #ArcGISEarth230Tips | Tip 12: See Beyond with the Viewshed Analysis Tool 🔭🌄

    Did you know?

    ArcGIS Earth’s Viewshed Analysis tool allows you to visualize what areas are visible or hidden from a specific location. This powerful feature helps you assess line-of-sight coverage, making it essential for urban planning, security assessments, and infrastructure development.

    🛠️ How to Maximize the Viewshed Tool:

    Set an observer point anywhere on the map, and ArcGIS Earth will instantly generate a viewshed area, highlighting visible regions in green and obstructed areas in red. Easily adjust the observer’s height, viewing angle, and distance range to analyze how terrain, buildings, or other obstacles impact visibility. This tool is perfect for evaluating the placement of security cameras, communication towers, or scenic viewpoints.

    🚀 Pro Tips:

    1️⃣ Adjust Observer Height: Increase the observer’s elevation to analyze visibility from elevated structures like towers or rooftops.

    2️⃣ Customize Viewing Angle: Narrow or widen the viewing angle to focus on specific areas or broaden the analysis.

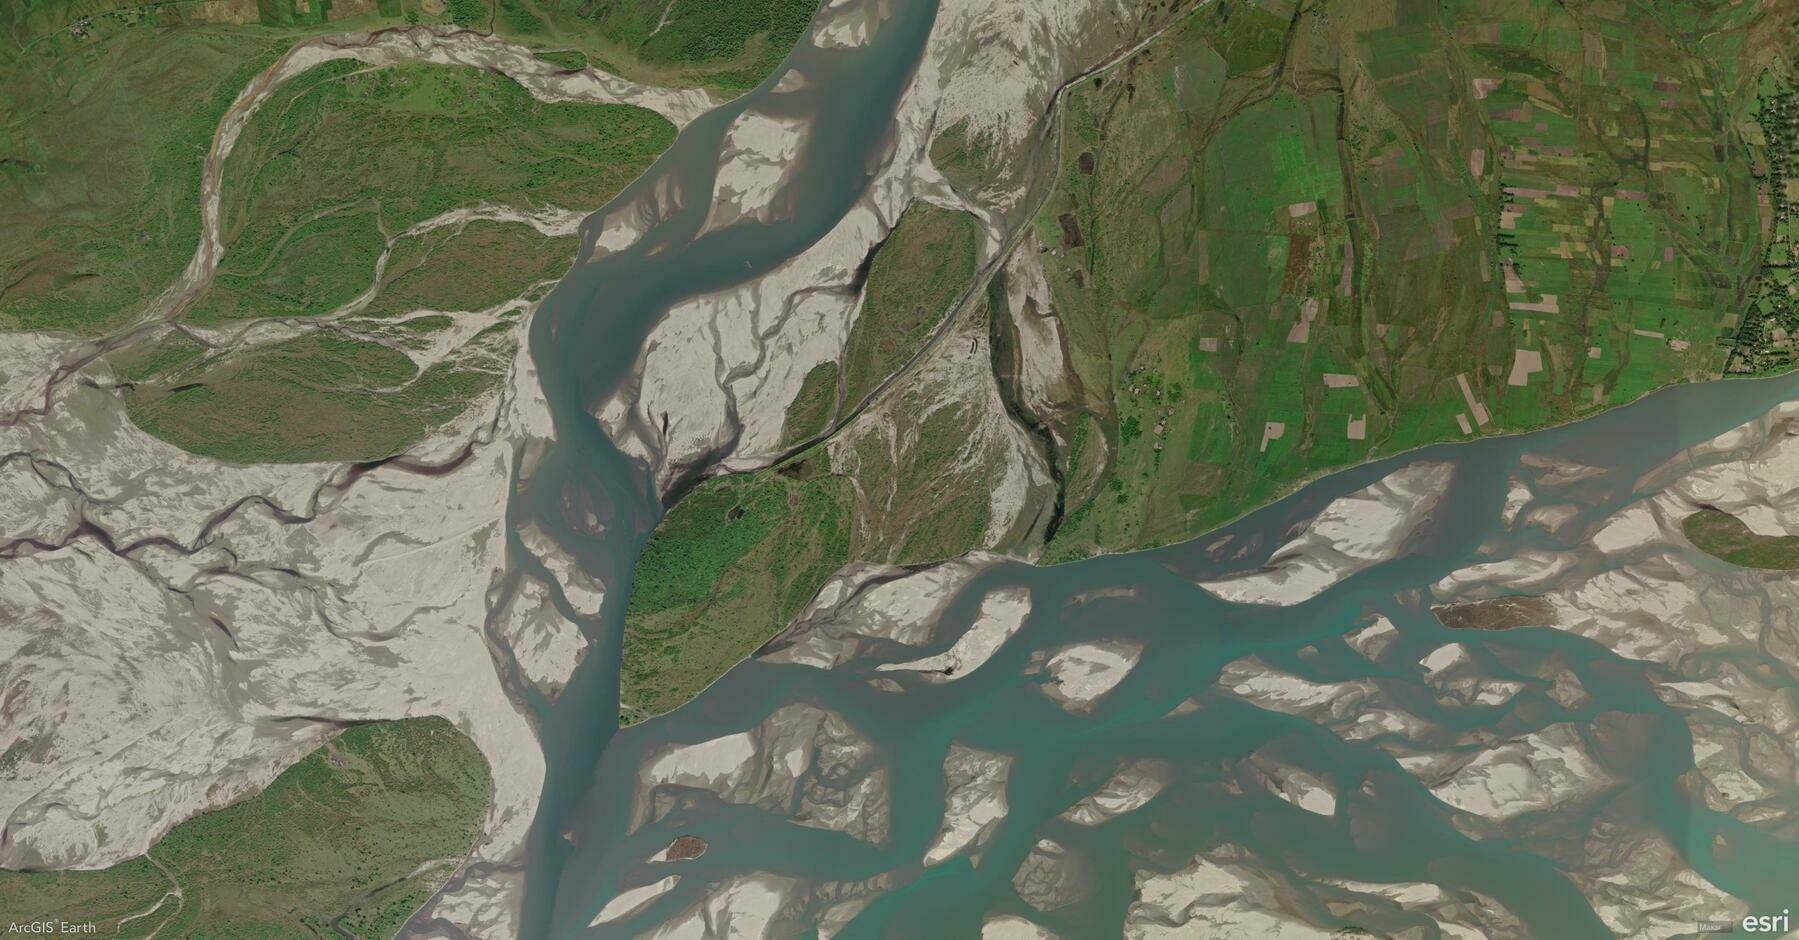
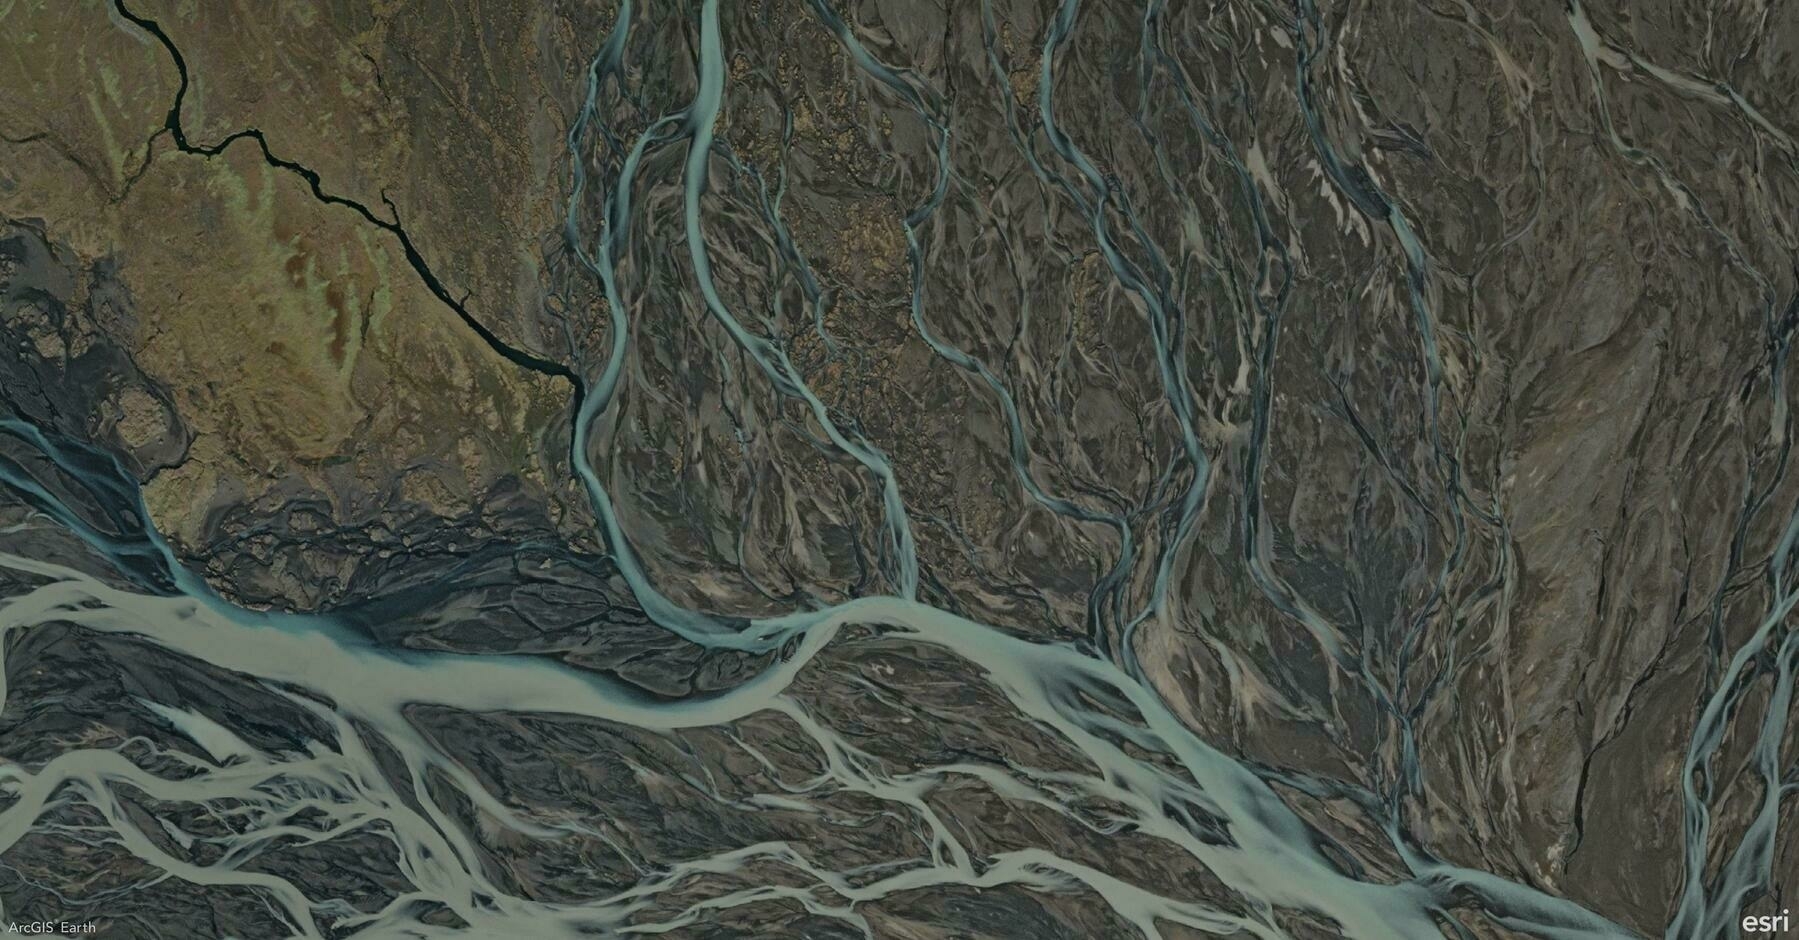
    Screenshot of Southern Region, Iceland, from ArcGIS Earth
    → 9:50 PM, Jan 16
    Also on Bluesky
  • 🌍 #ArcGISEarth230Tips | Tip 11: Master Visibility Analysis with the Line of Sight Tool 👁️📏

    Did you know?

    ArcGIS Earth’s Line of Sight tool allows you to instantly analyze visibility between an observer and one or more target points. This dynamic tool helps you evaluate clear and obstructed views in both 2D and 3D scenes, making it essential for security planning, infrastructure design, and environmental analysis.

    🛠️ 2 Powerful Ways to Use the Line of Sight Tool:

    1️⃣ From Point: Analyze Static Views📍

    Quickly analyze visibility by clicking to set the observer and target points. Green lines show clear views, and red lines highlight obstructions. Drag points or edit coordinates for precision—ideal for planning camera placements, communication towers, or observation decks.

    2️⃣ Animation: Simulate Moving Perspectives🚗✈️

    Take visibility analysis to the next level by creating an animated line of sight. Set a moving observer along a path—like a vehicle route or a drone flight path—and analyze how visibility changes in motion. You can select predefined vehicle or aircraft models or upload custom 3D models to reflect real-world scenarios. Adjust the animation speed, model offsets, and color schemes to fine-tune your analysis. This is ideal for assessing traffic surveillance, patrol routes, or aerial monitoring.

    🚀 Pro Tips:

    1️⃣ Terrain Precision: Press T while placing points to snap them to the terrain surface for more accurate results.

    2️⃣ Observer Perspective: Use the Apply Camera button to match the scene view with the observer’s position for a realistic perspective.

    Screenshot of Baja California, Mexico, from ArcGIS Earth
    → 10:12 PM, Jan 15
    Also on Bluesky
  • 🌍 #ArcGISEarth230Tips | Tip 10: Analyze Terrain with the Elevation Profile Tool 📈⛰️

    Did you know? ArcGIS Earth’s Elevation Profile tool allows you to visualize elevation changes along any path, offering valuable insights for terrain analysis, route planning, and risk assessment. You can easily generate interactive profiles from drawn lines, KML paths, or by using the Measure tool, making it a powerful feature for both analysis and presentation.

    🛠️ 3 Powerful Ways to Maximize the Elevation Profile Tool:

    1️⃣ Visualize Terrain Changes in Real-Time 🌄 Quickly generate an elevation profile by sketching a path or right-clicking an existing drawing line or KML line and selecting Elevation Profile. Instantly see how terrain rises and falls, making this perfect for planning hiking trails, infrastructure routes, or assessing construction sites.

    2️⃣ Analyze Elevation and Slope Metrics 📊 Gain immediate insights with detailed metrics like minimum, average, and maximum elevation, total elevation gain/loss, and slope percentages. This data is essential for identifying high-risk landslide zones, optimizing transportation routes, or evaluating flood-prone areas.

    3️⃣ Interact with and Share Profiles 🖱️🖼️ Hover over the profile to check exact elevation, distance, and slope data or double-click to zoom directly to any point on the map. Easily export the profile as an image for reports or presentations, making it ideal for sharing insights with stakeholders and improving decision-making.

    🚀 Pro Tips:

    1️⃣ Flip Direction: Reverse the profile path for new insights using the Flip Direction tool.

    2️⃣ Spacebar Lock: Press the Spacebar to lock onto specific points for precise elevation and slope readings.

    3️⃣ Mobile to Desktop Integration: Record routes with GPS tracking on mobile and analyze elevation profiles on desktop for deeper insights.

    Screenshot of Doha, Qatar, from ArcGIS Earth
    → 9:16 PM, Jan 14
    Also on Bluesky
  • 🌍 #ArcGISEarth230Tips | Tip 9: Enhance Visualization with Atmosphere and Terrain Effects 🌄🌫️

    Did you know?

    ArcGIS Earth allows you to elevate your 3D visualizations with Atmosphere Effects and Terrain Exaggeration. These tools can bring your data to life by adding depth, realism, and emphasis to landscapes and terrain analysis.

    🛠️ 2 Powerful Ways to Boost Your 3D Visualization:

    1️⃣ Add Realism with Atmosphere Effects 🌫️ Switch between None, Horizon Only, and Realistic atmosphere settings to control haze and depth in your scene.

    2️⃣ Amplify Terrain with Exaggeration ⛰️ Adjust the terrain scale from 0–100, or up to 1,000 with admin configuration, to highlight geological features, flood risks, or urban developments.

    🚀 Pro Tip:

    Pair atmosphere effects with terrain exaggeration to create stunning visuals that resemble a Chinese landscape painting, blending subtle depth and dramatic elevation for both artistic and analytical impact.

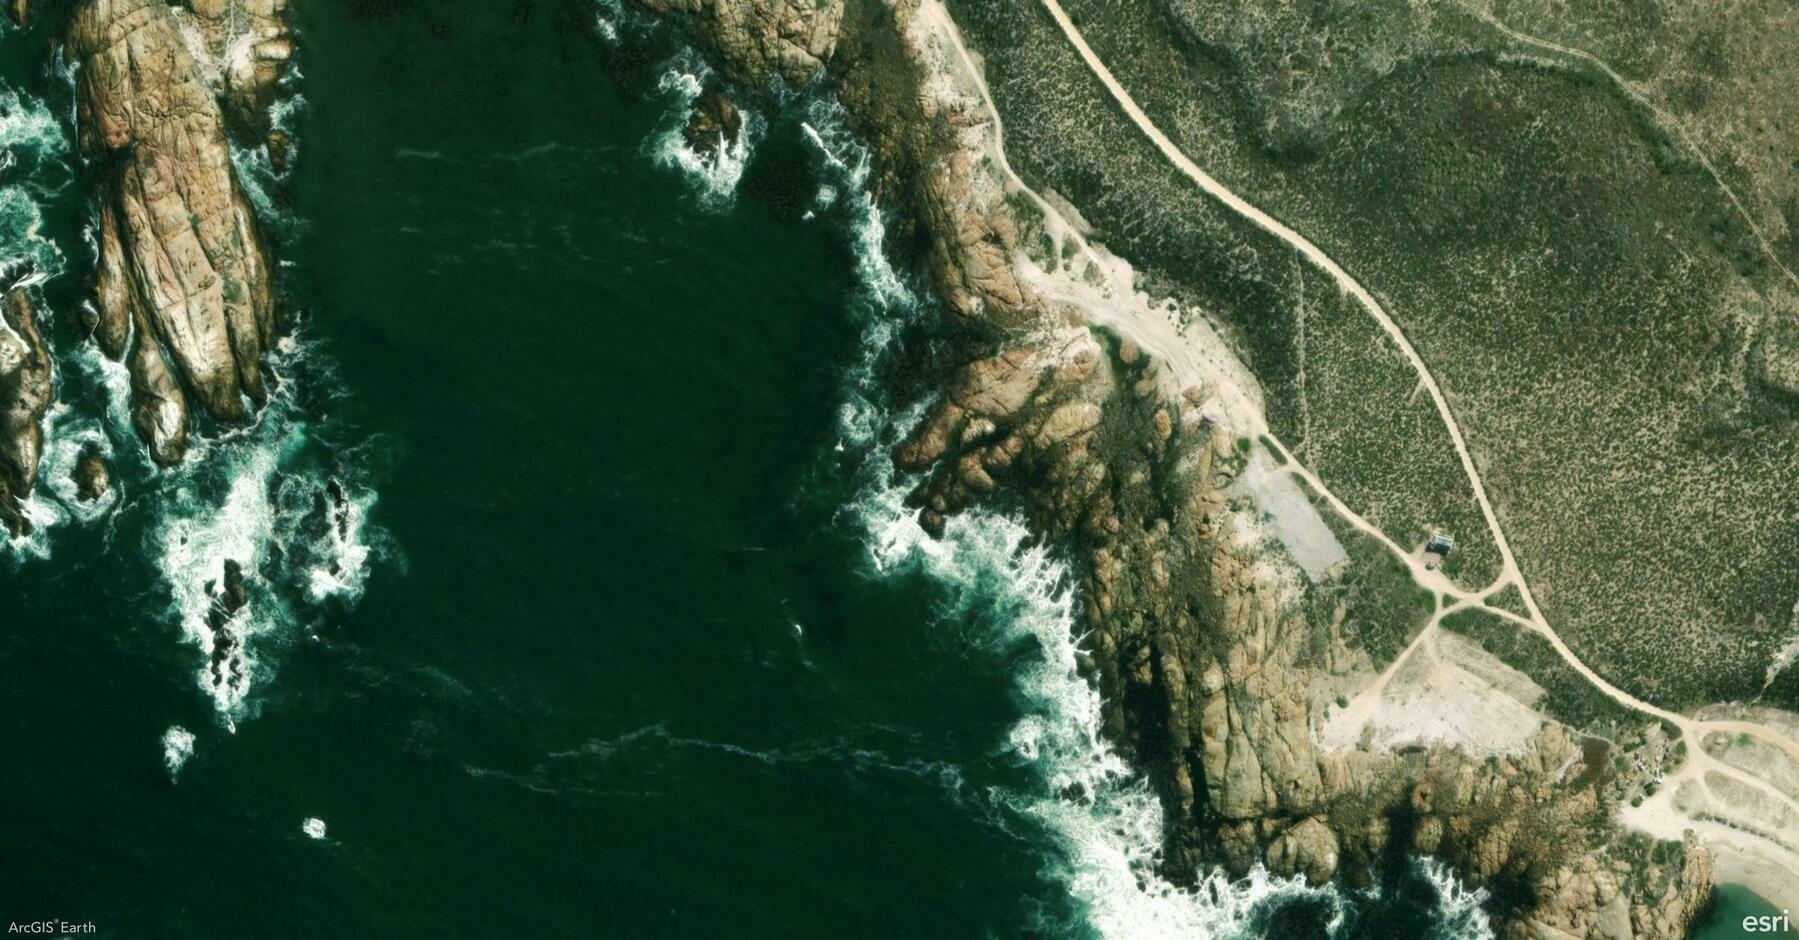
    Screenshot of West Coast Peninsula, South Africa, from ArcGIS Earth
    → 10:48 PM, Jan 13
    Also on Bluesky
← Newer Posts Page 4 of 5 Older Posts →
  • RSS
  • JSON Feed
  • Lucky
  • Archive
  • About