Puran
Today I Learned ArcGIS Earth Photos Reading Search Stats
  • 🌍 #ArcGISEarth230Tips | Tip 48: Share Your GPS Journeys Easily – Export NMEA as KML! 📤🗺️

    Want to share or archive your GPS tracks from ArcGIS Earth? Exporting your NMEA layer as a KML file is quick and easy.

    📁 Simple Export:

    After importing and visualizing your NMEA log, right-click the layer and save. You’ll get:

    • Points representing individual GPS fixes.
    • Polylines connecting your track path.

    It’s the perfect way to share your routes or archive valuable tracking data.

    🚀 Coming Soon: Enhanced KML Tracks:

    Currently, ArcGIS Earth exports points and lines to KML. Stay tuned for full KML Track support, including timestamped playback and richer temporal visualization!

    ✨ ArcGIS Earth empowers you to not only review your GPS logs but also transform them into easily shareable and presentation-ready KML files.

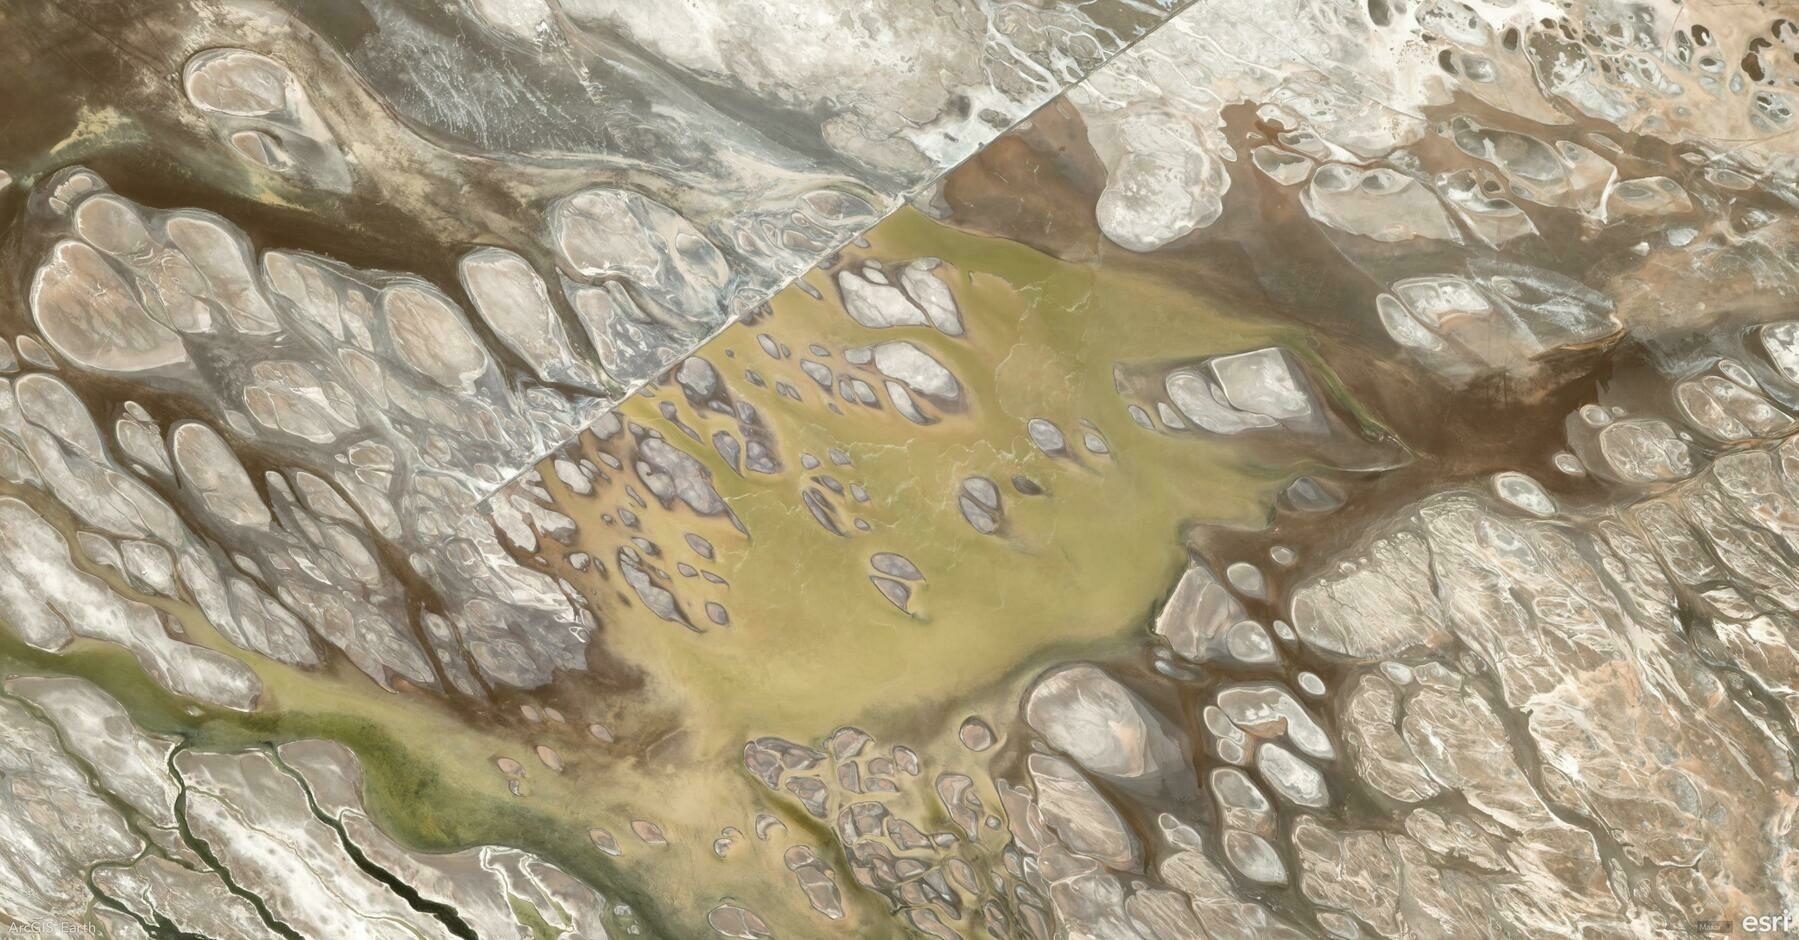
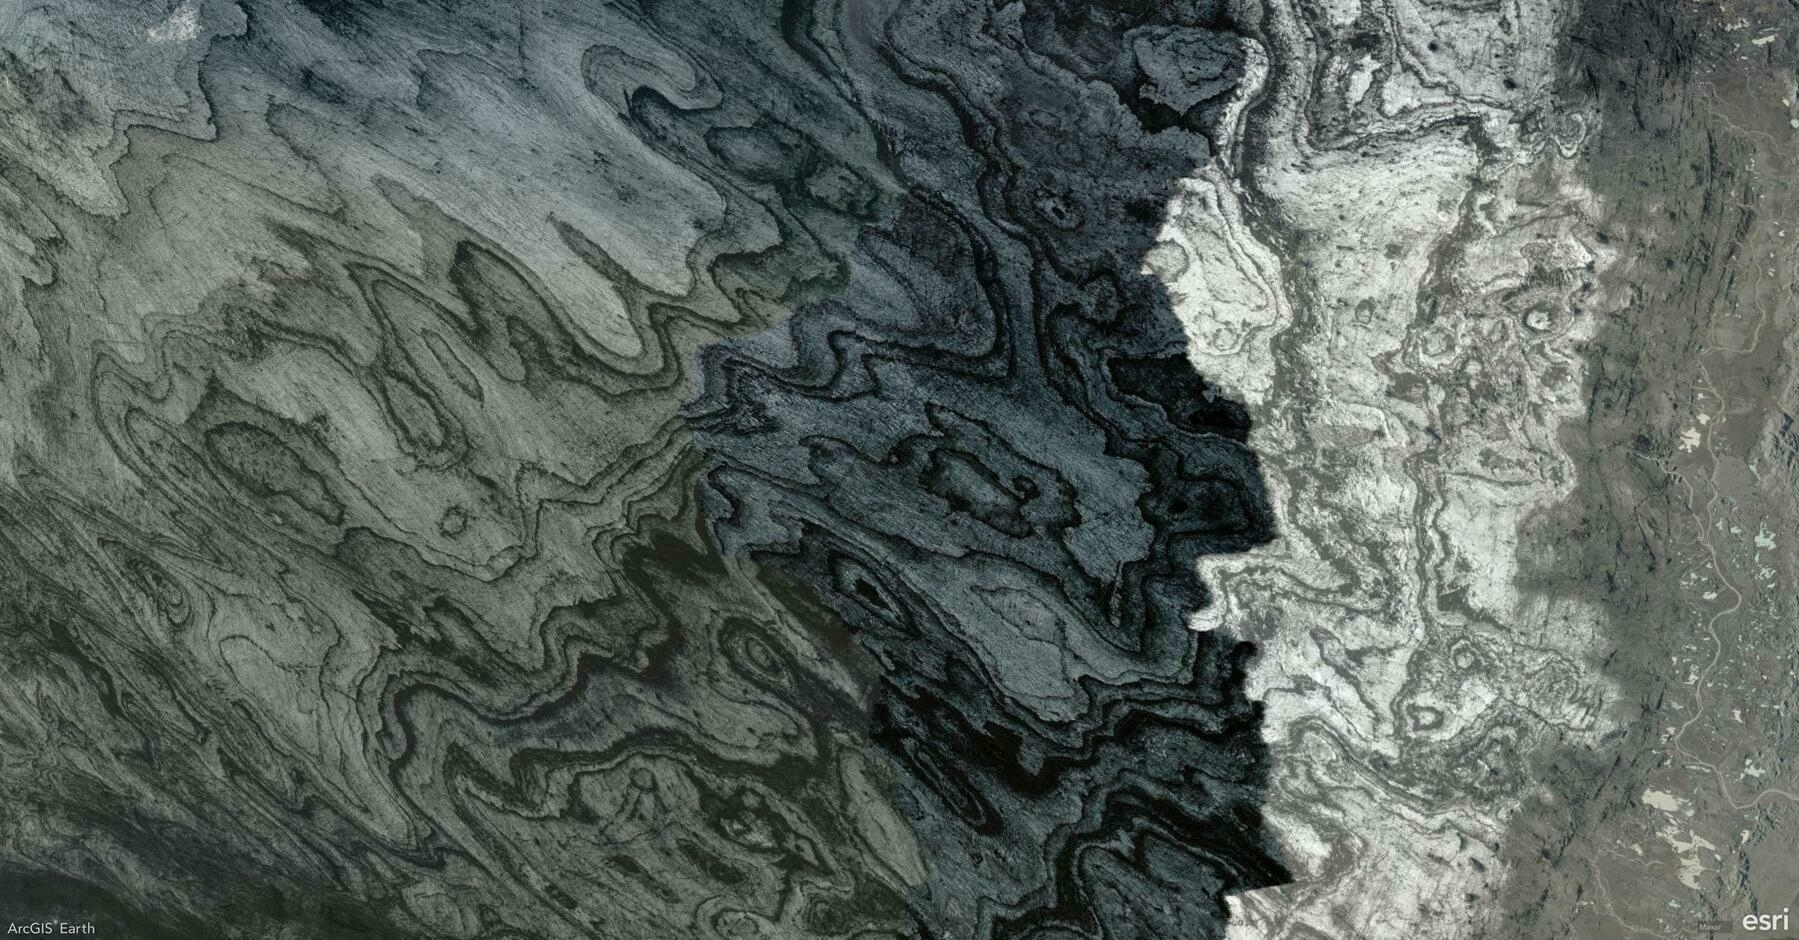
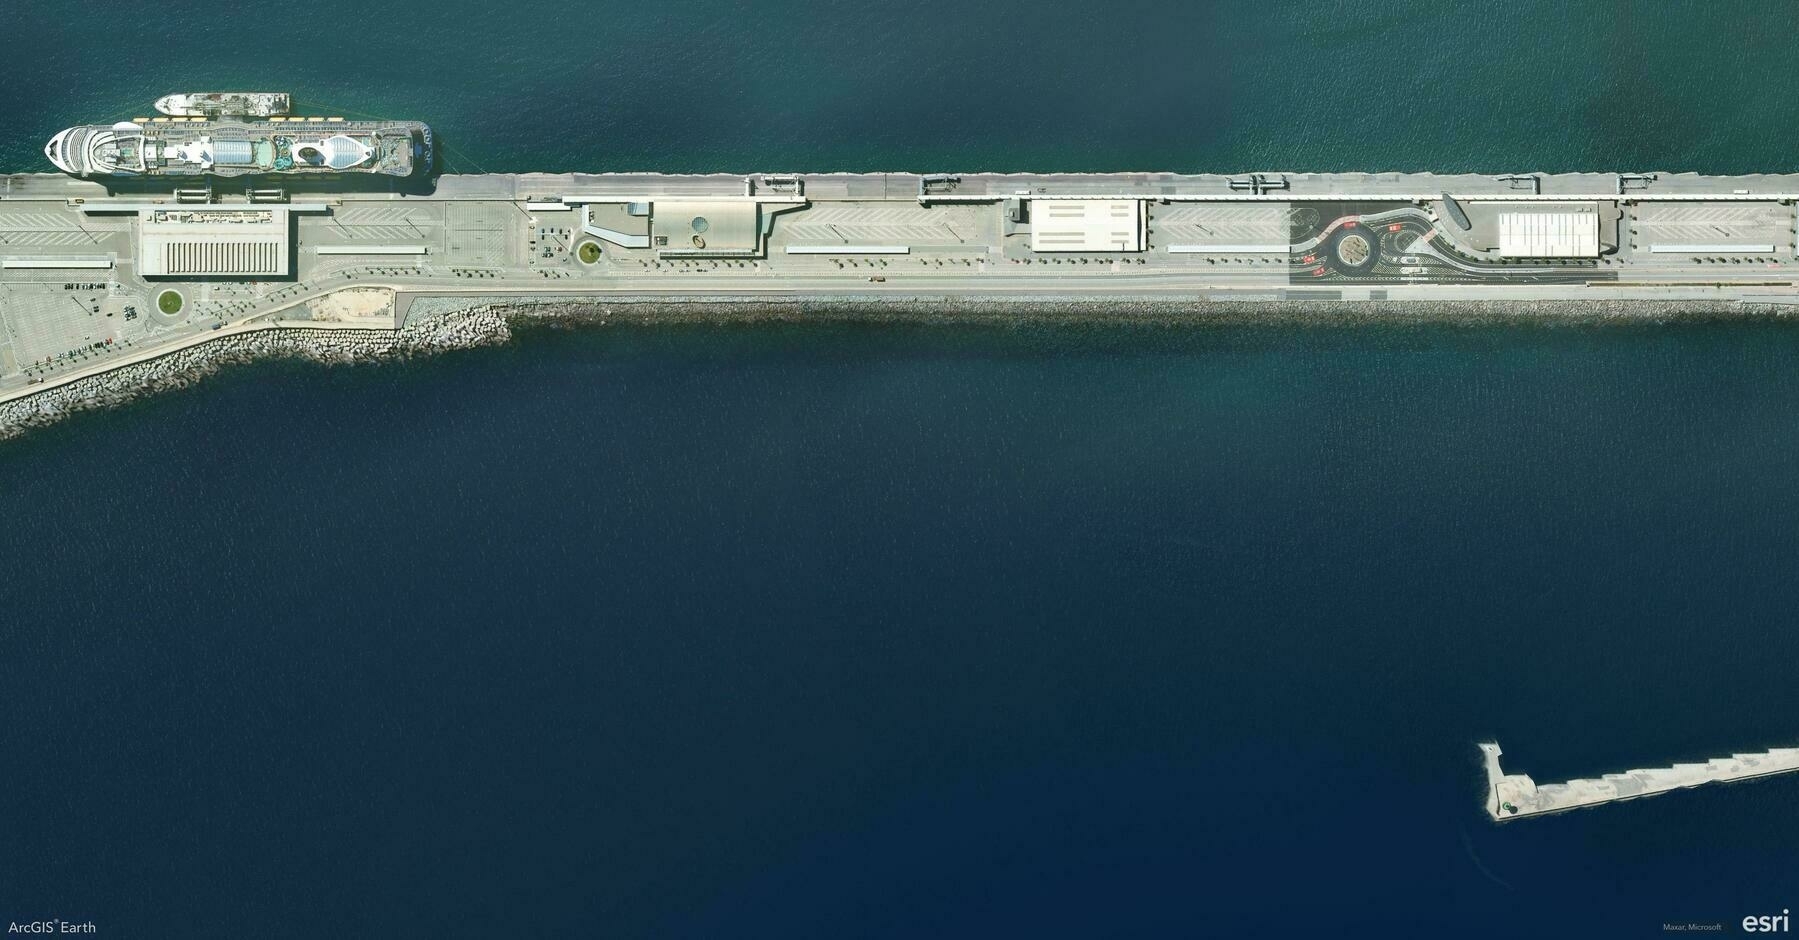
    Screenshot of Boutilimit, Mauritania, from ArcGIS Earth
    → 11:40 PM, Apr 11
    Also on Bluesky
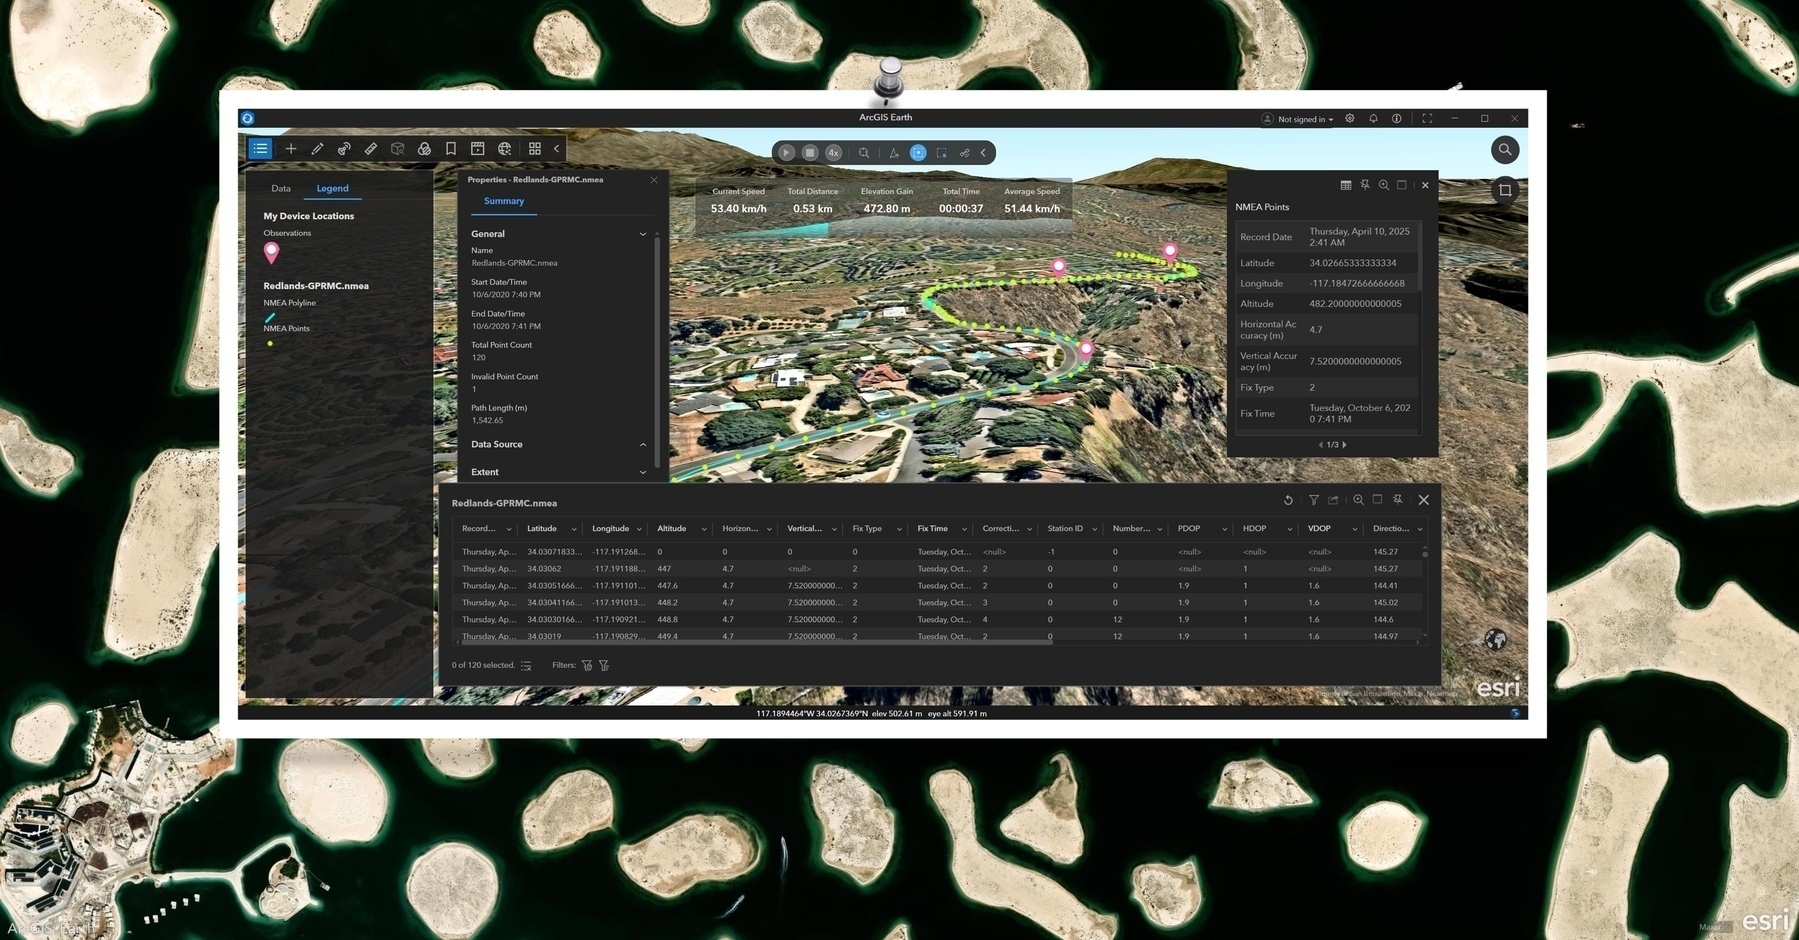
  • 🌍 #ArcGISEarth230Tips | Tip 47: Uncover the Hidden Insights in Your NMEA Data! 📑🔍

    Think your GPS tracks are just lines? Think again! ArcGIS Earth empowers you to dive deep into the metadata, attributes, and statistics embedded within your imported NMEA layers, revealing the full story.

    📄 Explore Layer Details:

    Right-click the NMEA layer and select “Properties” to access:

    • Metadata: spatial reference, extent, data source, and more.
    • Summary Statistics: a quick snapshot of your dataset’s structure.

    🖱️ Instant Feature Insights:

    • Use the “Identify” tool to click any point or segment and instantly view its attribute information in a pop-up. Perfect for on-the-fly checks during playback or exploration.

    📊 Dive into the Data Table:

    Open the “Attribute Table” to:

    • See all your GPS records in one comprehensive view.
    • Sort, filter, and analyze your data effectively.
    • Select specific records and zoom directly to them on the map.

    ✨ Go beyond the lines! ArcGIS Earth provides the tools to unlock the rich contextual information within your NMEA data, transforming simple tracks into powerful insights.

    Screenshot of Dubai, United Arab Emirates, from ArcGIS Earth
    → 11:21 PM, Apr 10
    Also on Bluesky
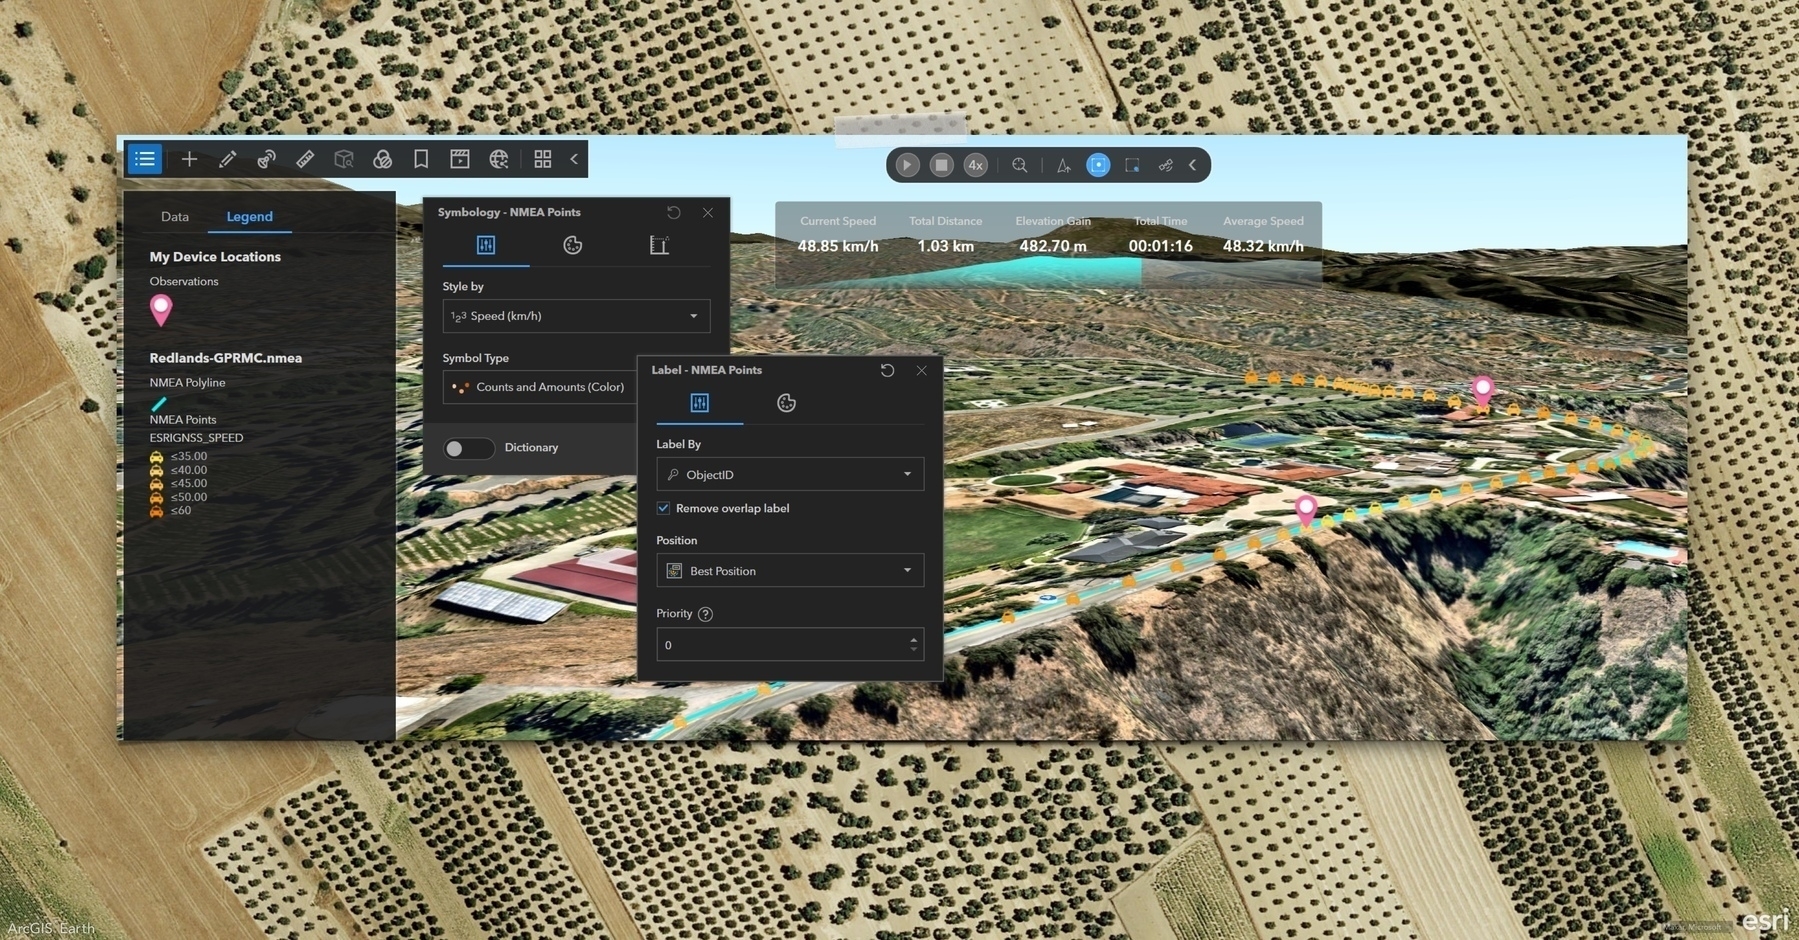
  • 🌍 #ArcGISEarth230Tips | Tip 46: Visualize Your GPS Tracks – Style NMEA Data for Impact! 🖌️📍

    Imported an NMEA log into ArcGIS Earth? Awesome! Now, transform it into a powerful visual story by customizing its appearance for clearer analysis and compelling presentations.

    🗺️ Control Your View:

    • Right-click the NMEA layer in the Table of Contents and select “Display.”
    • Choose to show Points, Polyline, or Both to focus on key aspects of your track.

    🎨 Style for Insight:

    • Treat your NMEA layer like any feature layer – unleash the power of symbology!
    • Apply color ramps to highlight speed, accuracy, or elevation variations.
    • Adjust size and style for optimal visibility in immersive 3D scenes.

    🏷️ Label for Context:

    • Bring your data to life by labeling attributes like timestamp, speed, or elevation.
    • Enhance analysis and presentations with crucial contextual information.
    • Add dynamic real-time context to your visual playback.

    ✨ Unleash the full potential of your NMEA data! By taking control of display and styling, you transform raw data into insightful and visually captivating narratives.

    Screenshot of Beas, Spain, from ArcGIS Earth
    → 9:07 PM, Apr 9
    Also on Bluesky
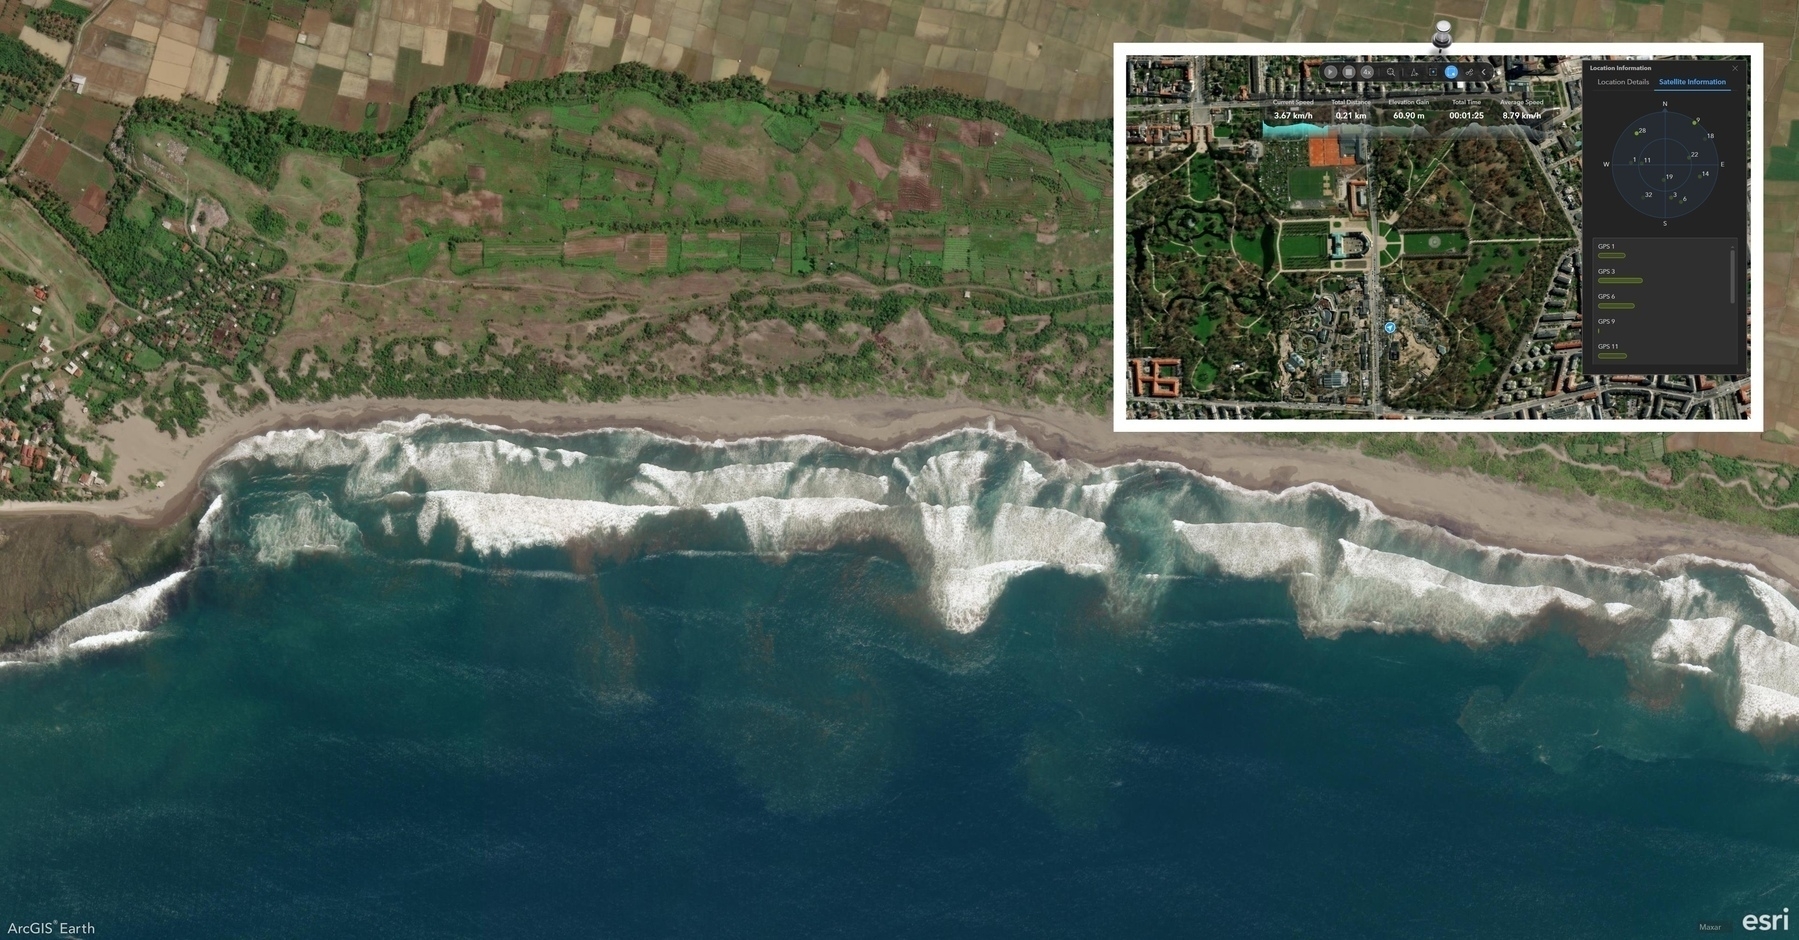
  • 🌍 #ArcGISEarth230Tips | Tip 45: Dive into Satellite & Location Details with NMEA Logs 🛰️📍

    Did you know that ArcGIS Earth not only replays NMEA GPS tracks—but also lets you explore detailed positioning and satellite data at every moment?

    📍 Go Beyond the Map with Location Information When working with an imported NMEA log, click the Location Information button to open two insightful tabs:

    🧭 Location Details

    Access key metrics about the device’s current position:

    • Latitude, Longitude, Altitude
    • Accuracy level and Fix type
    • HDOP (Horizontal Dilution of Precision)
    • VDOP (Vertical Dilution of Precision)
    • PDOP (Positional Dilution of Precision)

    These details help you assess GPS signal quality and positioning precision throughout the track.

    🛰 Satellite Information

    Visualize the satellite environment in real time:

    • View the relative position of each satellite in the sky
    • Signal strength is displayed with dynamic bars—longer and darker = stronger signal
    • A compass-style map shows satellites orbiting around the device at the center

    ✨ This view updates continuously, giving you a real-time window into satellite coverage and positioning accuracy.

    Screenshot of Garut Regency, Indonesia, from ArcGIS Earth
    → 9:46 PM, Apr 8
    Also on Bluesky
  • 🌍 #ArcGISEarth230Tips | Tip 44: Bring GPS Tracks to Life with NMEA Log Support 🛰

    Did you know ArcGIS Earth supports NMEA log file import, enabling you to visualize and analyze GPS tracks with ease?

    📡 What is NMEA 0183?

    NMEA 0183 is a widely adopted standard developed by the National Marine Electronics Association. It defines how GPS devices and marine instruments—such as sonar, anemometers, autopilots, and more—communicate using simple ASCII “sentences” over serial connections.

    It’s the most common GPS data format, supported by virtually every GPS manufacturer.

    🗺️ ArcGIS Earth Makes It Visual

    Simply import a NMEA-formatted log file into ArcGIS Earth to bring your movements to life on a map.

    🔁 Playback & Insight at Your Fingertips

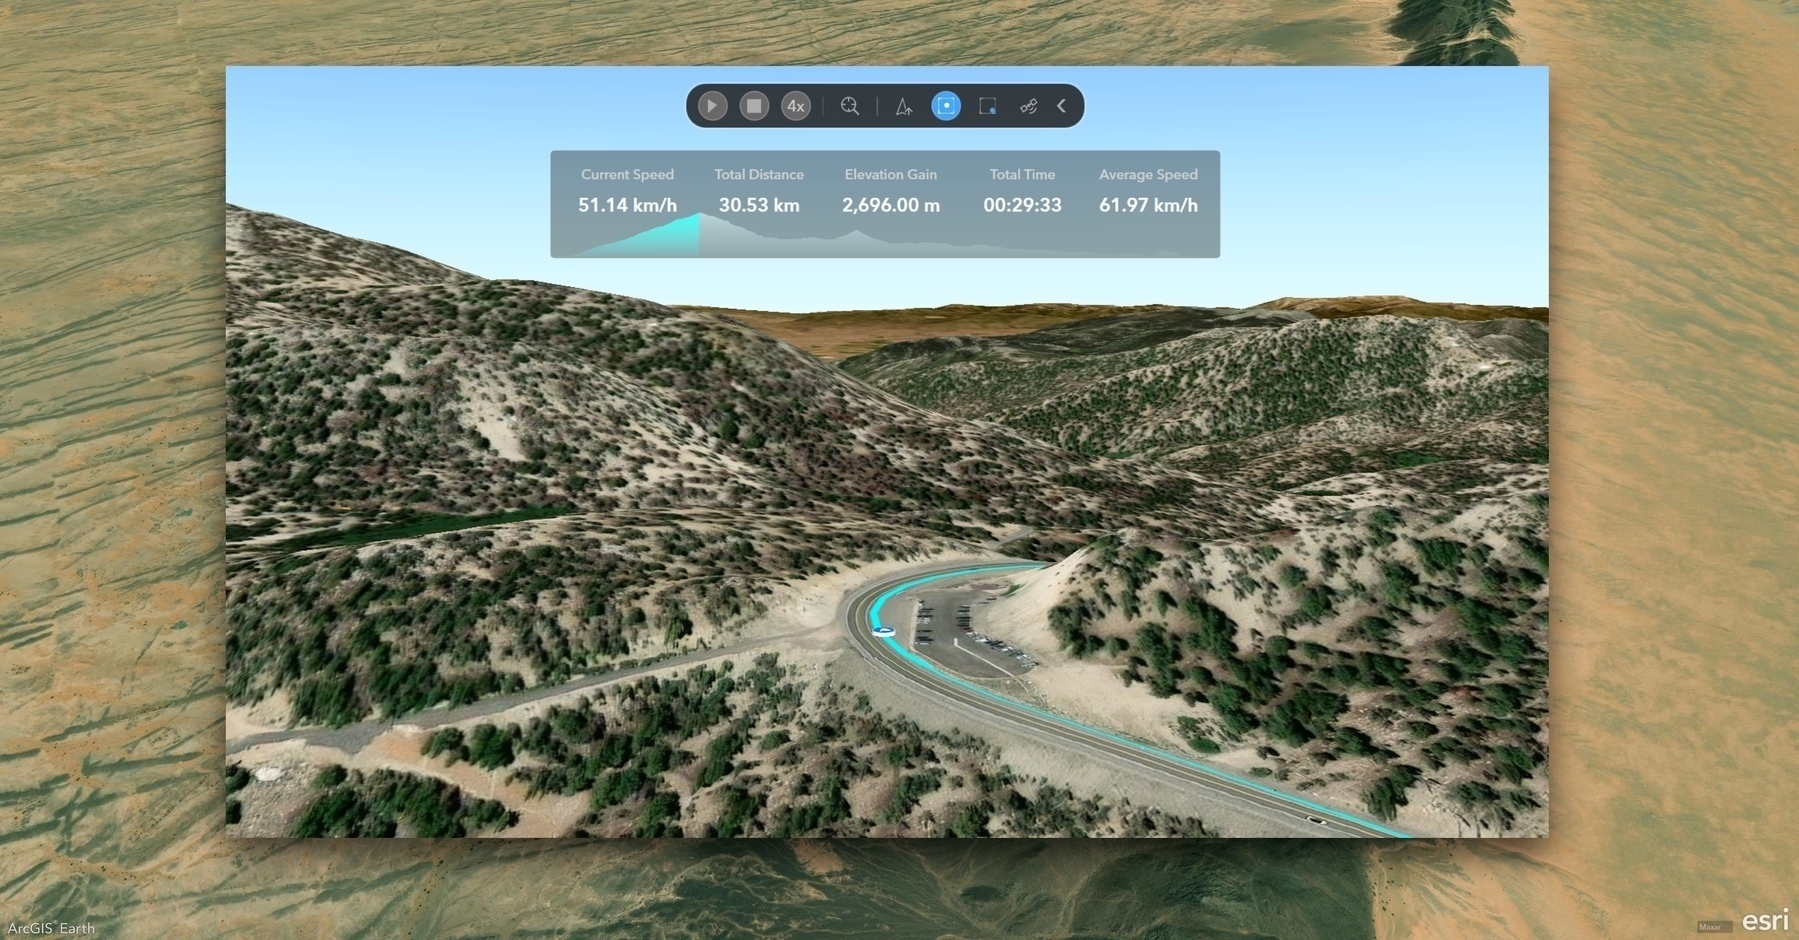
    Once imported, select the NMEA layer to open the GNSS Toolbar and Dashboard:

    • ▶️ Play or pause the GPS track
    • 🐇🐢 Adjust playback speed in real time
    • 🧭 Choose your view mode: Track-Up, Keep at Center, or Keep within Window
    • 📊 View live stats: current speed, total distance, elevation gain, total time, and average speed
    • 📈 Monitor progress with an interactive elevation profile

    🎯 Real-World Application

    Whether you’re reviewing a field mission, validating GPS data, or training with real-world tracks, this feature transforms raw GPS logs into powerful, interactive stories.

    Screenshot of Zug, Western Sahara, from ArcGIS Earth
    → 11:19 PM, Apr 7
    Also on Bluesky
  • 🌍 #ArcGISEarth230Tips | Tip 43: Open & Share Maps Instantly with ArcGIS Earth App Links! 🔗📲

    Did you know?

    With ArcGIS Earth Mobile, you can use App Links to launch the app with preset views, add data automatically, and share locations or layers with a single tap—making it easier than ever to integrate GIS workflows across mobile applications.

    🛠️ How to Use App Links in ArcGIS Earth Mobile

    1️⃣ Launch ArcGIS Earth Using an App Link

    • Open ArcGIS Earth from a web-style URL: https://earth.arcgis.app/?{parameters}.
    • If the app is not installed, the link will redirect to the download page on the App Store, Google Play, or Microsoft Store.

    2️⃣ Use App Links with Parameters

    • Customize a link to open ArcGIS Earth at a specific viewpoint, load a dataset, or adjust the camera view.
    • Example: https://earth.arcgis.app/?viewpoint=cam:116.1156,39.2429,48632.27;10.46,68.09&url=https://www.arcgis.com/home/item.html?id=fdf0409b2dd940b2a9bc31f63152f08c

    3️⃣ Share a View with QR Codes

    • Capture & share your current map view by generating a QR code.
    • Scan the QR code with a mobile device to instantly open the same view in ArcGIS Earth.

    4️⃣ Share & Load Online Data via App Links

    • Long-press a layer in the Table of Contents to generate a shareable QR code with an App Link.
    • Scan the QR code to open ArcGIS Earth and automatically add the data to the scene.

    🚀 Pro Tips

    1️⃣ Use App Links in reports, emails, or field apps to seamlessly open ArcGIS Earth at predefined locations with relevant data. 2️⃣ Encode the parameters properly using the ArcGIS Arcade UrlEncode function.

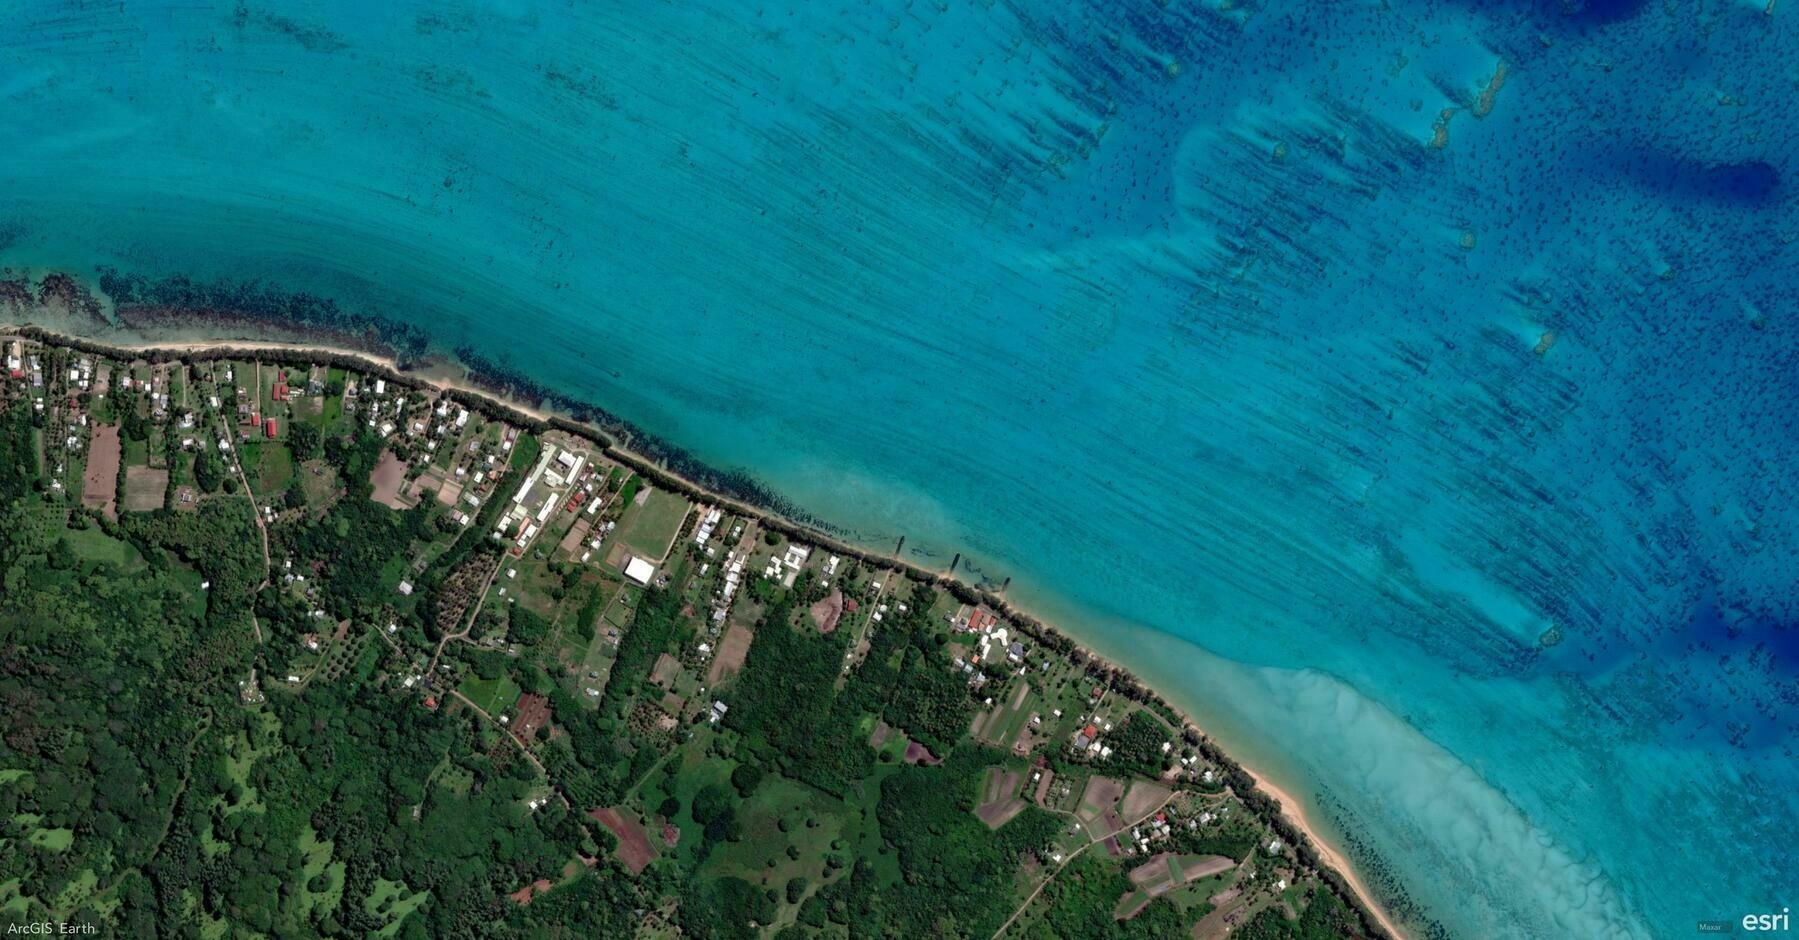
    Screenshot of Îles Tubuaï, French Polynesia, from ArcGIS Earth
    → 12:04 AM, Mar 22
    Also on Bluesky
  • 🌍 #ArcGISEarth230Tips | Tip 42: Discover & Explore Geospatial Content with ArcGIS Gallery! 📂📲

    Did you know?

    The ArcGIS Gallery, kindly called the Mini Stage, provides an easy way to discover and explore ready-to-use 3D content—perfect for new users and those looking for quick access to authoritative geospatial data for analysis, planning, and presentations.

    🛠️ How to Use ArcGIS Gallery in ArcGIS Earth Mobile

    1️⃣ Access the ArcGIS Gallery

    • First-time users: The Mini Stage appears after installation, suggesting six recommended datasets—four for default scenes and two for AR Mode.
    • Anytime access: Open My Account → Tap Explore ArcGIS Gallery 📂.

    2️⃣ Add Data from the Gallery

    • Tap a recommended dataset to load it into the 2D or 3D scene.
    • Select AR-labeled content to visualize data in Augmented Reality Mode.
    • Tap More to explore additional datasets through the Portal page.
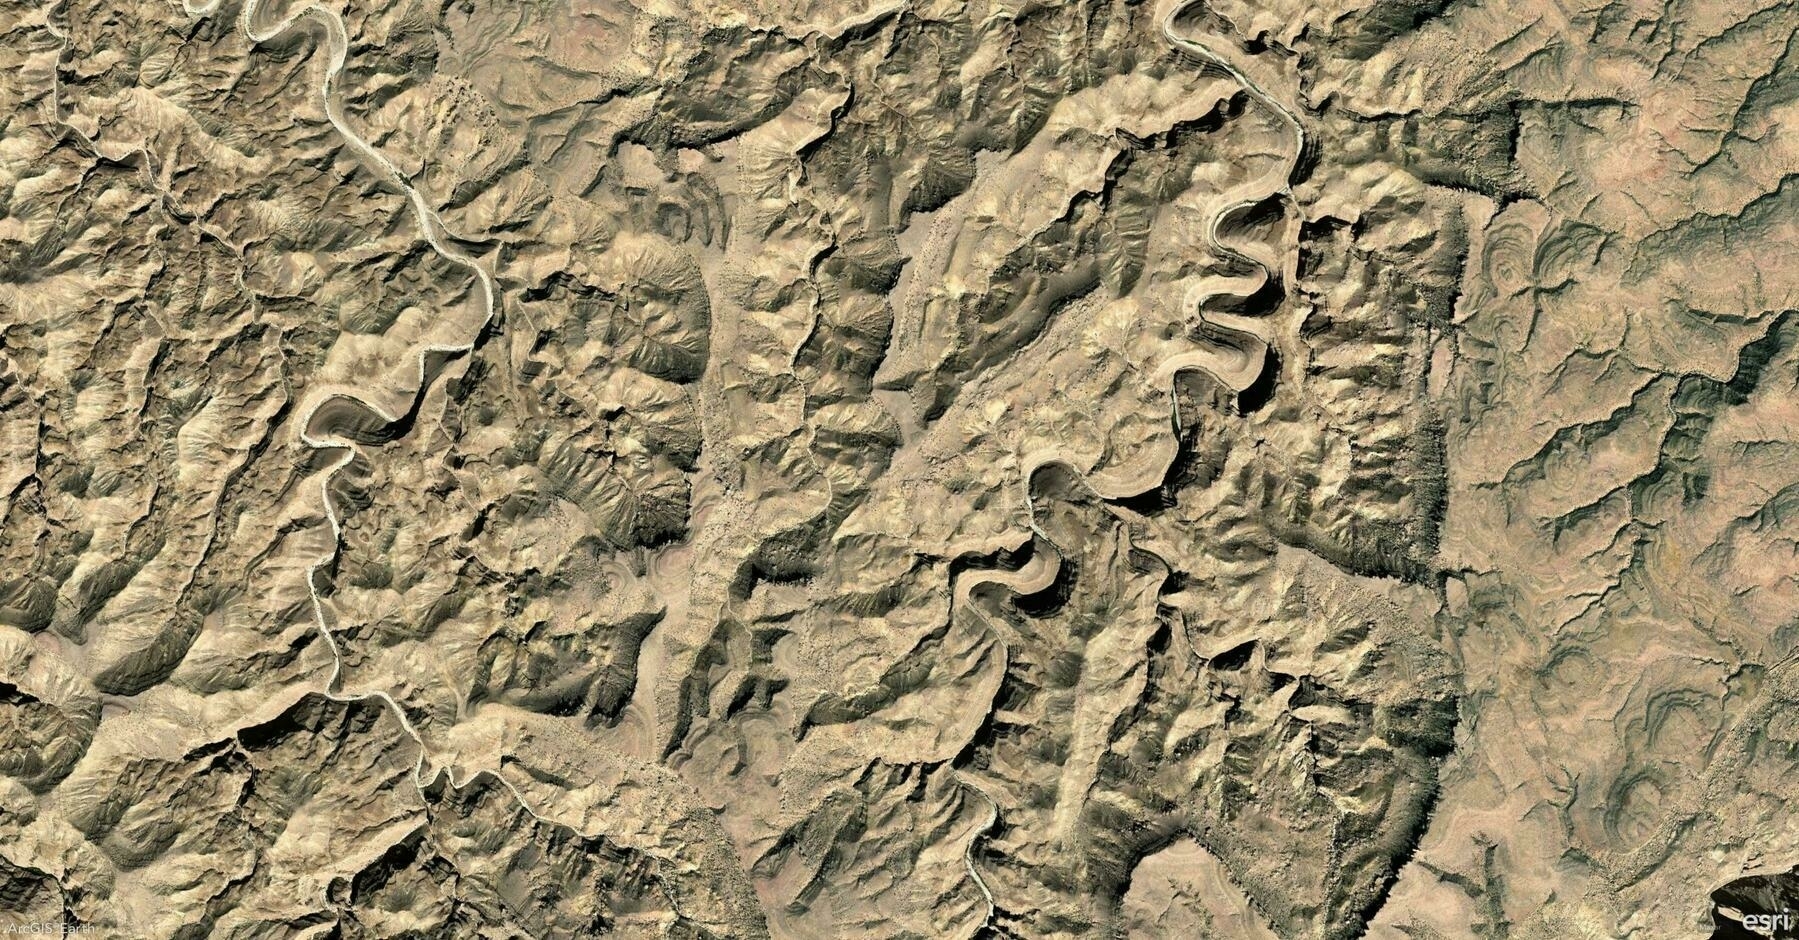
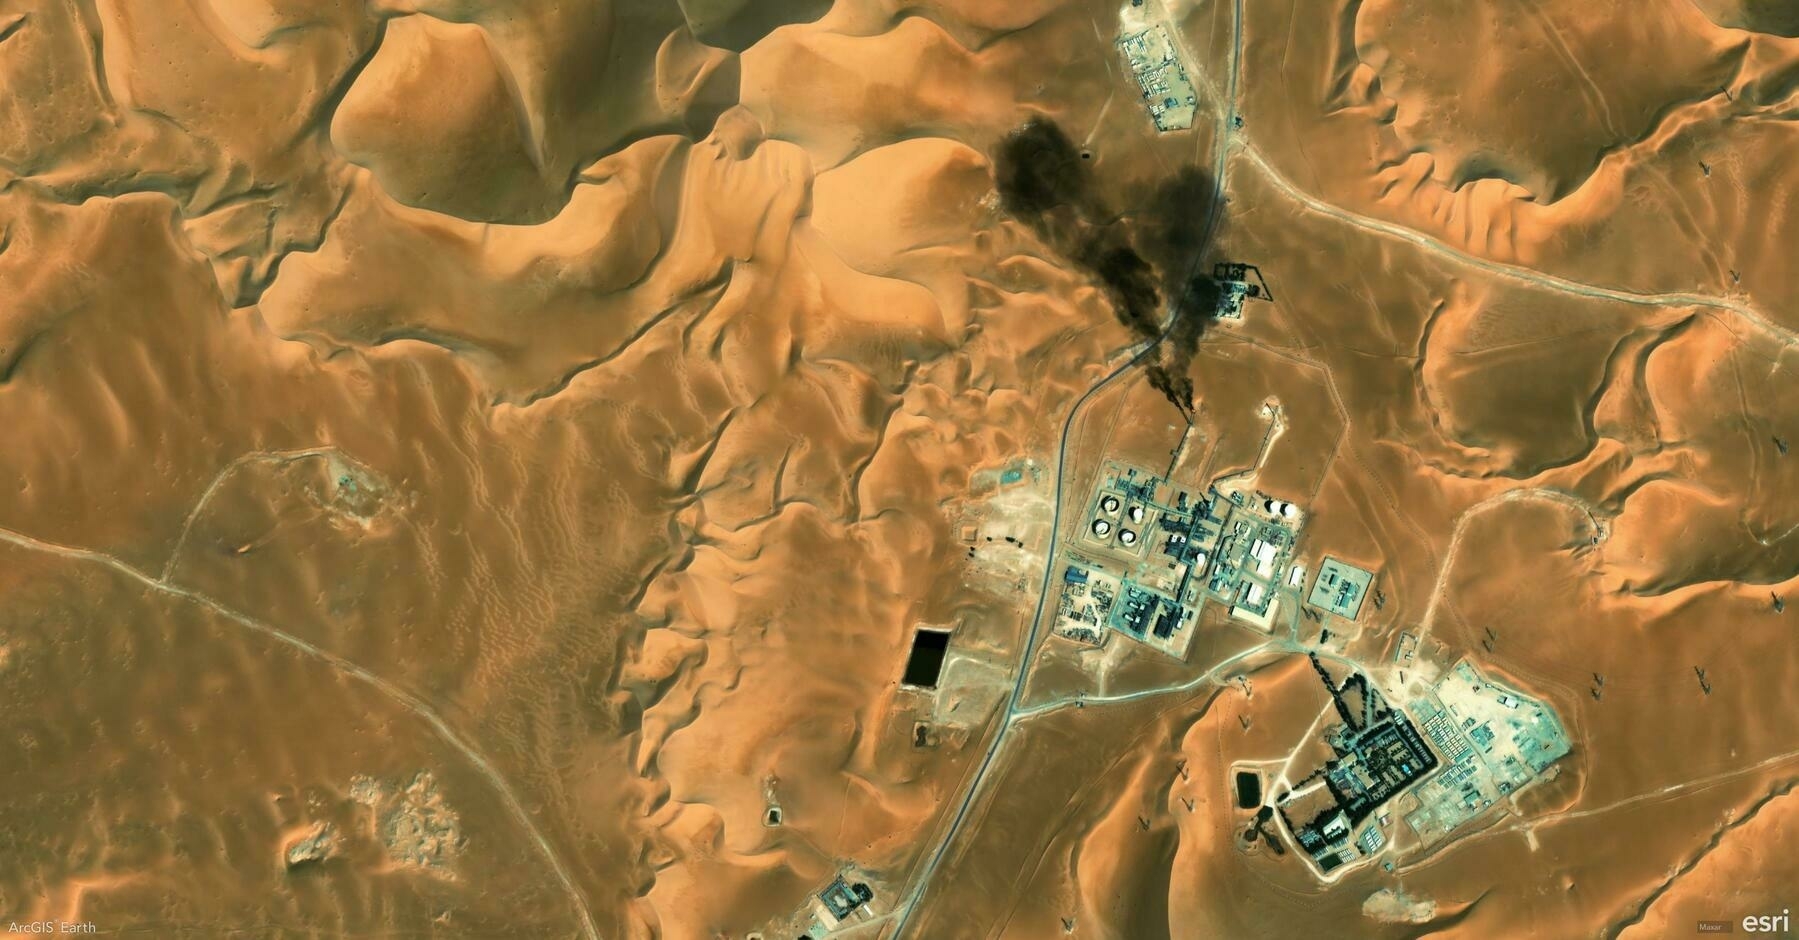
    Screenshot of Dhofar Governorate, Oman, from ArcGIS Earth
    → 11:44 PM, Mar 20
    Also on Bluesky
  • 🌍 #ArcGISEarth230Tips | Tip 41: Bring Your GIS Data to Life with AR Mode! 📡📲

    Did you know?

    With ArcGIS Earth Mobile, you can visualize 3D GIS data in Augmented Reality (AR) Mode, allowing you to interact with spatial content in the real world! Plus, you can now record videos and capture snapshots directly within the app to share your AR experiences effortlessly.

    🛠️ How to Use AR Mode in ArcGIS Earth Mobile

    1️⃣ Enter AR Mode

    • Option 1: Select AR data from the ArcGIS Gallery when launching the app.
    • Option 2: Long-press or swipe left on a layer in the Table of Contents to activate AR mode.

    2️⃣ Visualize & Interact with Data

    • Scan your surroundings to detect a flat surface for placing data.
    • Tap to place a KML, 3D model, or scene layer in AR.
    • Use gestures to move, scale, and rotate the 3D content for better alignment.

    3️⃣ Capture & Share Your AR Experience

    • 📸 Take a Screenshot – Instantly capture a high-resolution snapshot of your AR scene.
    • 🎥 Record a Video – Use the built-in screen recording tool to capture AR animations and save them directly to your device.
    • 🚀 One-Click Sharing – Easily share your AR visuals with colleagues, stakeholders, or social media.

    🚀 Pro Tips

    1️⃣ Use AR mode for site planning, asset visualization, and interactive presentations.

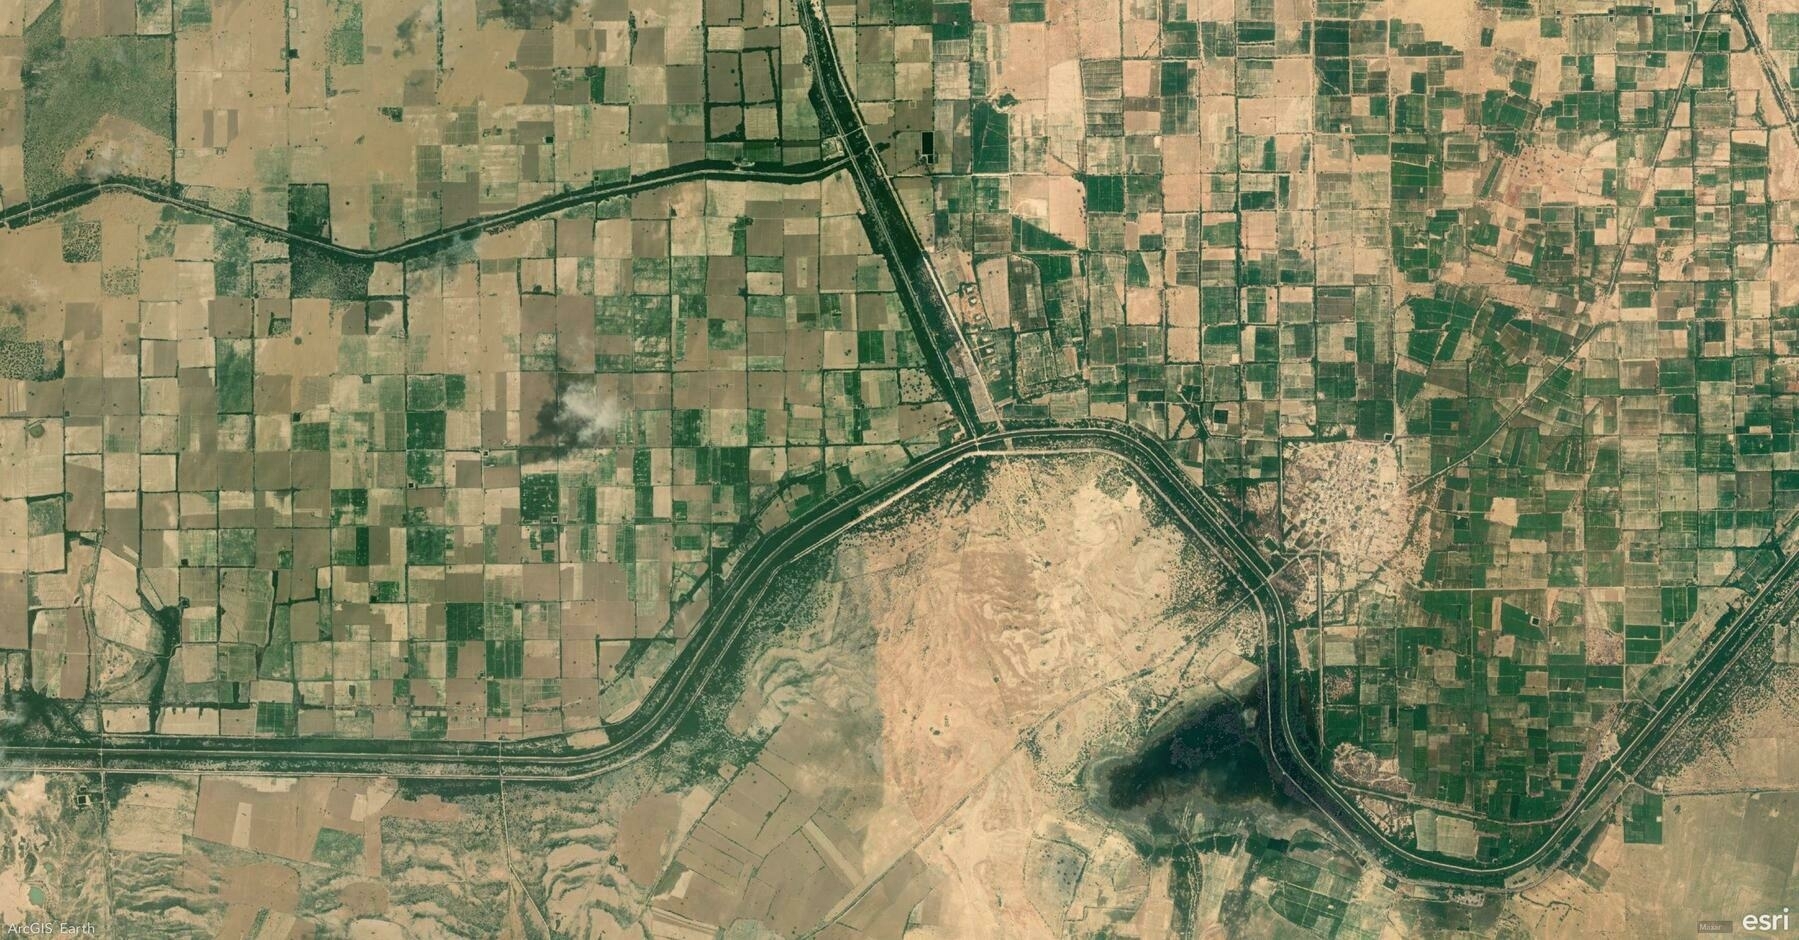
    Screenshot of Sadhna, India, from ArcGIS Earth
    → 10:56 PM, Mar 19
    Also on Bluesky
  • 🌍 #ArcGISEarth230Tips | Tip 40: Navigate & Visualize Underground Data on Mobile! 🔍📲

    Did you know?

    With ArcGIS Earth Mobile, you can navigate below the surface to explore subway systems, underground utilities, or geological formations—perfect for urban planning, infrastructure management, and environmental analysis!

    🛠️ How to Enable Underground Mode

    1️⃣ Activate Underground Navigation

    • Tap the Toolbox 🧰 → Select Underground Mode 🌏.
    • The terrain adjusts automatically, allowing seamless subsurface navigation.

    2️⃣ Explore & Interact with Underground Features

    • Pan, tilt, and zoom to navigate below the surface.
    • Identify subway systems, pipelines, and underground structures.

    3️⃣ Adjust Transparency for Clarity

    • Open the Underground Panel to fine-tune ground transparency for better visibility.
    • Overlay aboveground and underground layers for a comprehensive spatial view.

    🚀 Pro Tips

    1️⃣ Overlay 3D layers for a seamless transition between aboveground and subsurface data.

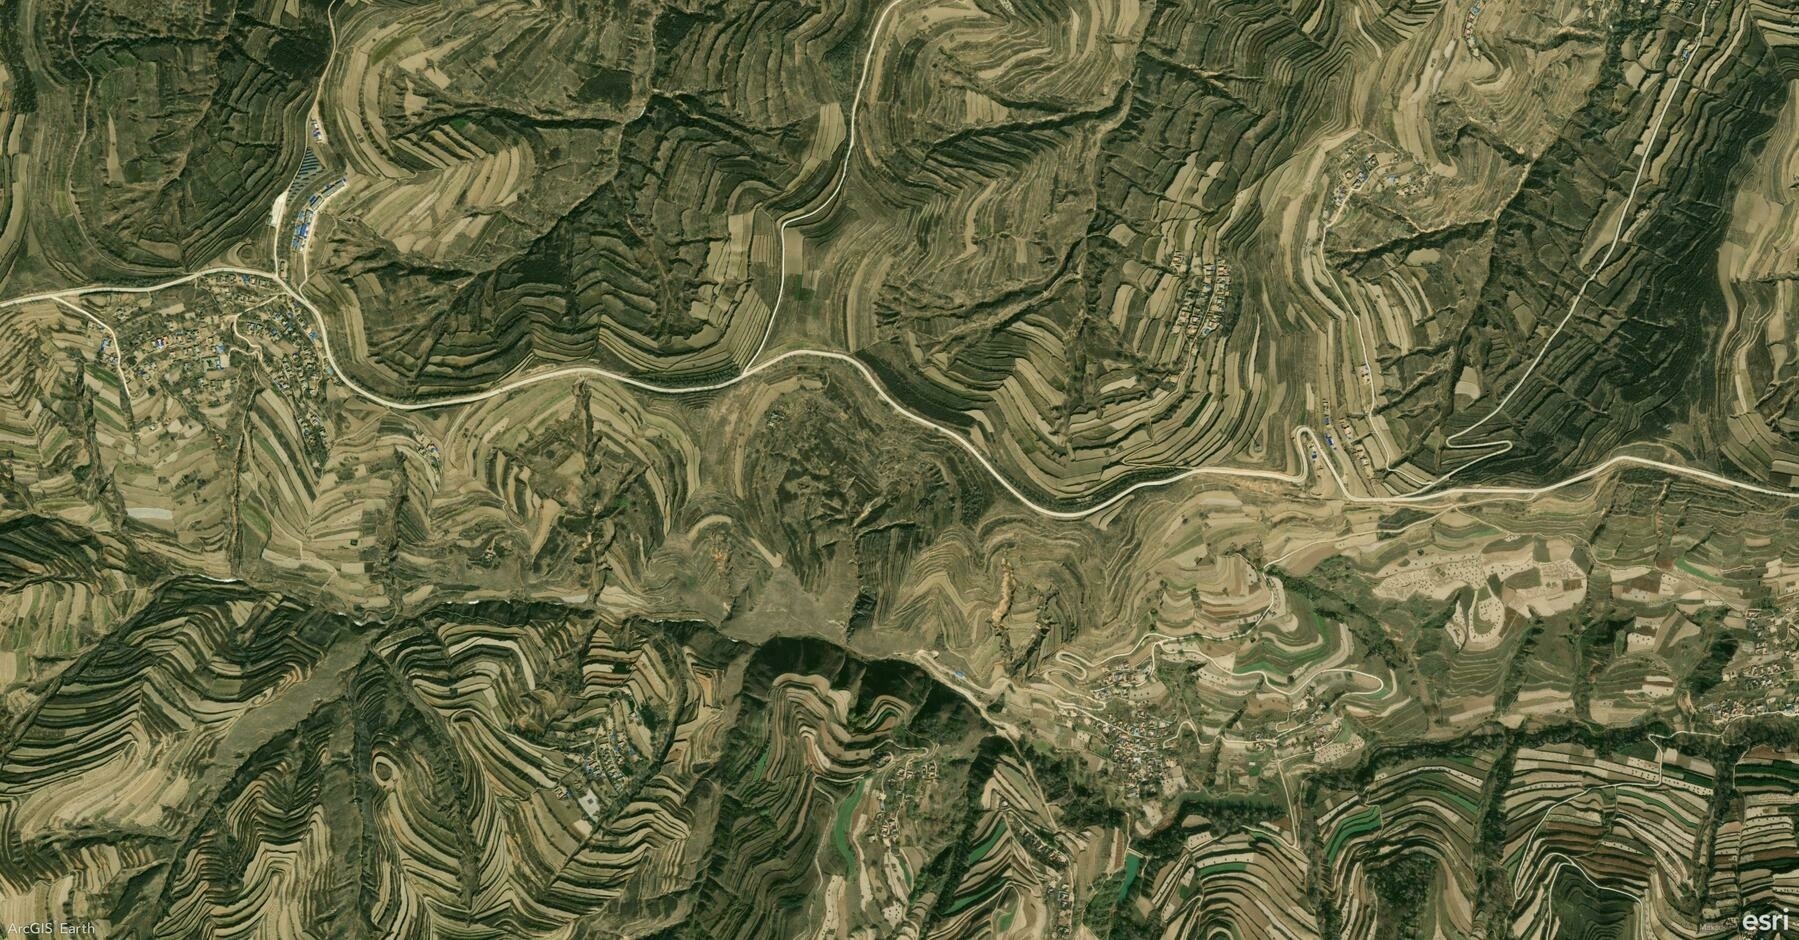
    Screenshot of Dingxi Shi, China, from ArcGIS Earth
    → 9:31 PM, Mar 18
    Also on Bluesky
  • 🌍 #ArcGISEarth230Tips | Tip 39: Capture & Share Your Journeys with Mobile GPS Tracks! 📍🚶‍♂️📲

    Did you know?

    ArcGIS Earth Mobile lets you record real-time GPS tracks, replay routes, and share them as KMZ files. Perfect for fieldwork, navigation, and detailed route analysis!

    🛠️ How to Record & Share GPS Tracks:

    1️⃣ Configure Your Tracking:

    • Tap the Toolbox 🧰 → Track 📍.
    • Adjust GPS accuracy and streaming frequency in Settings ⚙️.
    • Choose your tracking style (line/footprint) and enable Z-values for elevation.

    2️⃣ Record & Manage:

    • Tap Start ▶️ to begin. Pause ⏸️ and resume as needed.
    • Tracks record in the background. Stop ⏹️ to finish and save.

    3️⃣ Analyze Your Track:

    • Access saved tracks in “My Tracks.”
    • View detailed stats: origin, distance, duration, speed, and elevation profiles.

    4️⃣ Share Your Data:

    • Export as KMZ for offline use.
    • Upload to ArcGIS Enterprise/Online for collaboration.
    • Create a shareable card with a snapshot and elevation profile.

    🚀 Pro Tips:

    • Use background tracking for seamless recording.
    • Import tracks into ArcGIS Earth Desktop for advanced 3D analysis.
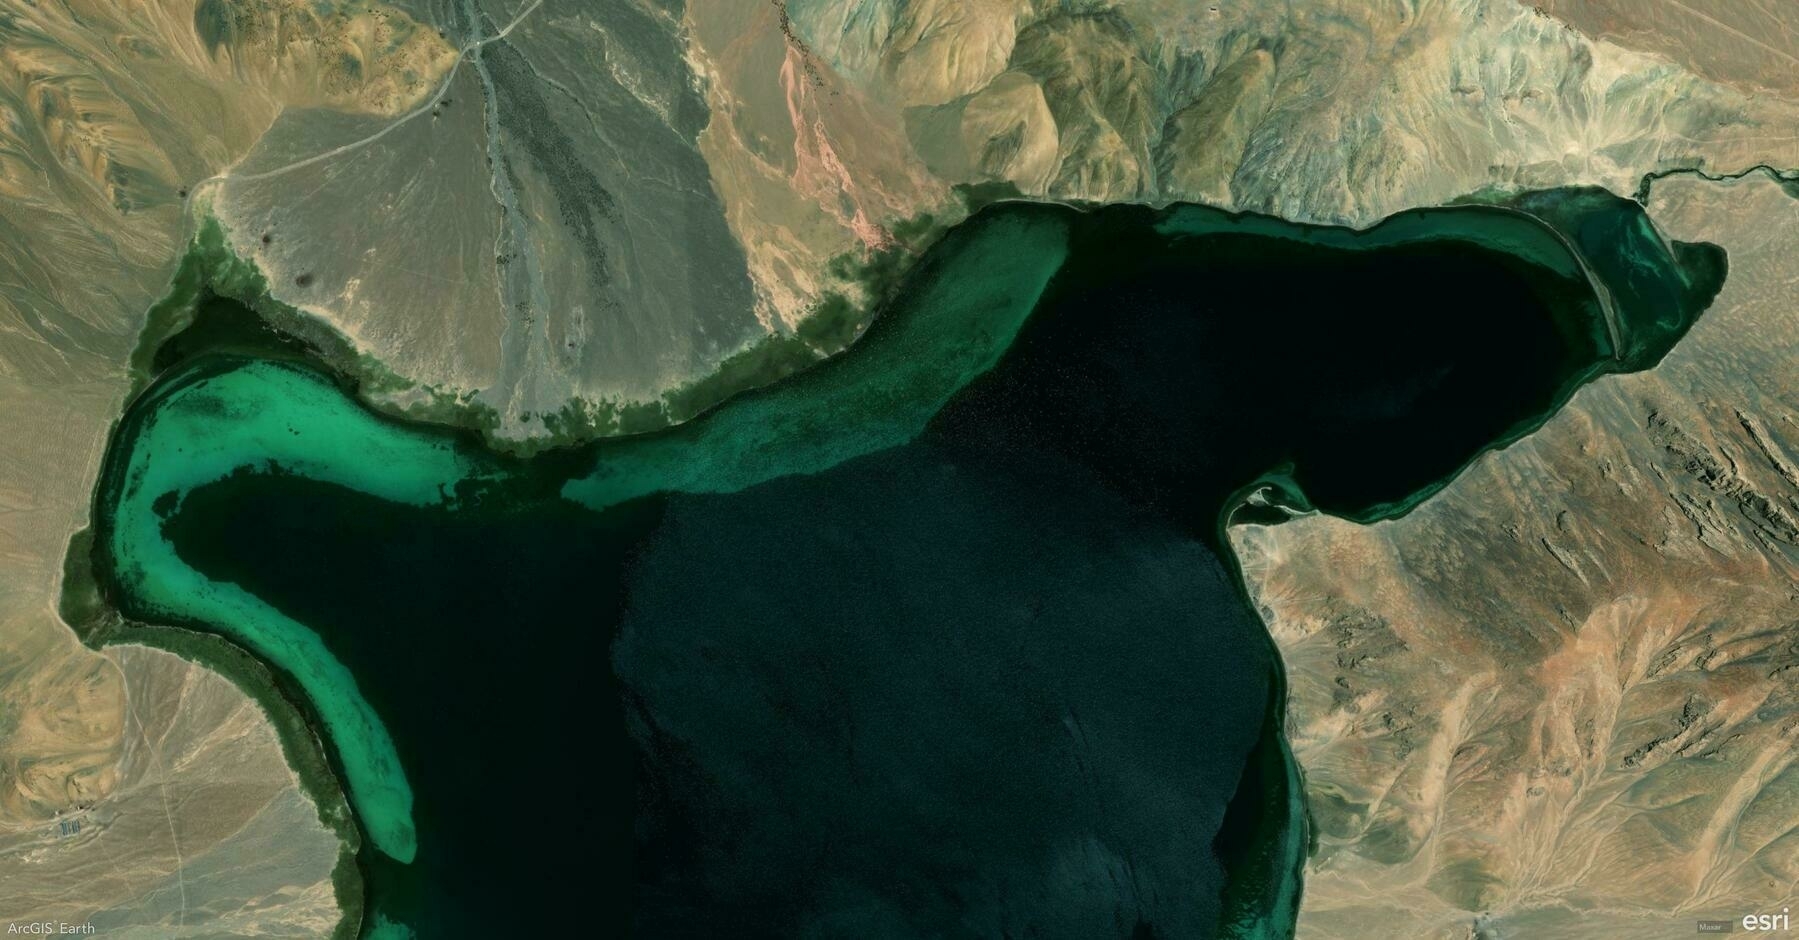
    Screenshot of Ngari, China, from ArcGIS Earth
    → 8:53 PM, Mar 17
    Also on Bluesky
  • 🌍 #ArcGISEarth230Tips | Tip 38: Create & Share Interactive Tours on Mobile! 🎥📲

    Did you know?

    ArcGIS Earth Mobile lets you build engaging, interactive tours using geotagged photos and placemarks? Document your travels, showcase locations, or guide viewers through spatial data – and even record your tour as a shareable video!

    🛠️ How to Create a Tour in ArcGIS Earth Mobile:

    1️⃣ Add Tour Stops:

    • Open the Toolbox 🧰, select “Tour,” and add Tour stops.
    • Choose from existing placemarks or search for locations.
    • Use geotagged photos from your album or capture new ones (location data required).

    2️⃣ Customize & Preview:

    • Rename your tour and add a detailed description.
    • Use “Overview” to see all stops on a 3D map, or “Play” ▶️ to preview and adjust viewpoints and playback duration.
    • Edit stops: reorder, add text, and customize path colors.

    3️⃣ Save & Share Your Tour:

    • Export as KMZ for sharing or upload to ArcGIS Enterprise.
    • Tap “Share” to record your tour as a video and save it to your album. (Note: Globe interaction is disabled during recording).

    🚀 Pro Tips:

    1️⃣ Utilize tours for guided fieldwork, immersive virtual storytelling, or detailed trip documentation. 2️⃣ Combine stunning 3D views with photos and text for a truly engaging experience.

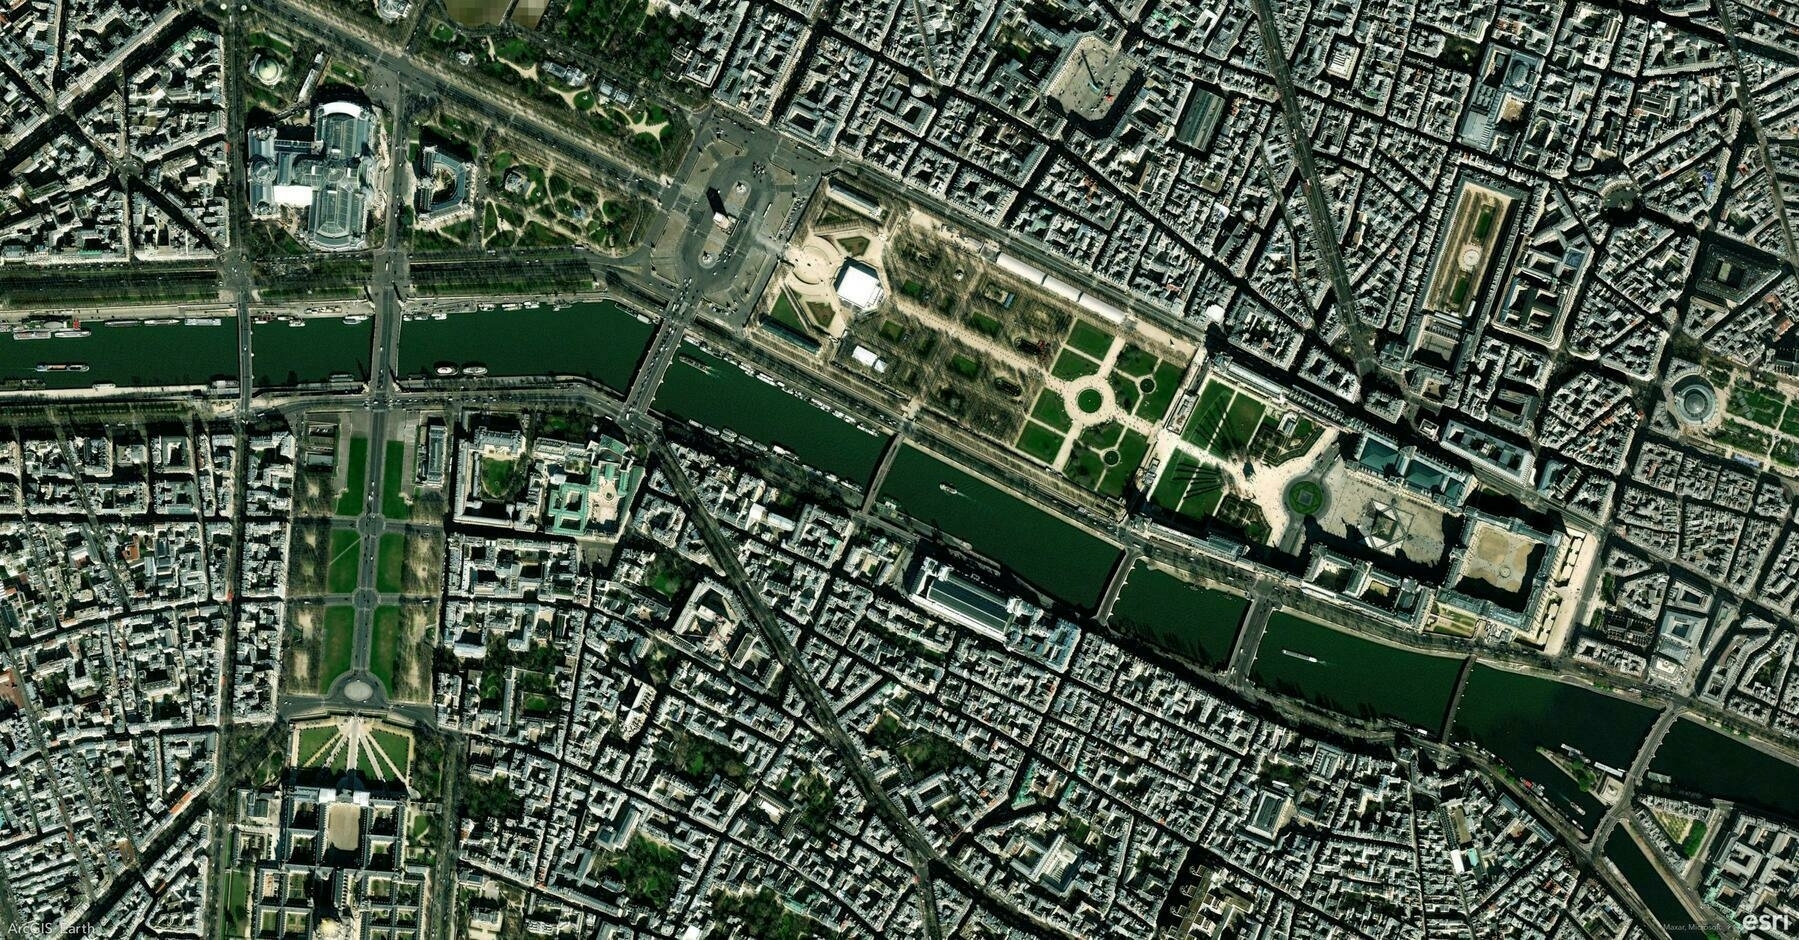
    Screenshot of Paris, France, from ArcGIS Earth
    → 9:06 PM, Mar 14
    Also on Bluesky
  • 🌍 #ArcGISEarth230Tips | Tip 37: Perform Line of Sight & Viewshed Analysis on Mobile! 👀📲

    Did you know?

    With ArcGIS Earth Mobile, you can analyze visibility and obstructions in real time using Line of Sight and Viewshed Analysis—essential for urban planning, security assessments, and terrain evaluation!

    🛠️ How to Use Line of Sight & Viewshed Analysis

    1️⃣ Open the Analysis Tools Tap the Toolbox 🧰 → Select Line of Sight 👁️ or Viewshed 🌎.

    2️⃣ Perform a Visibility Analysis

    • 📍 Line of Sight – Set an observer point, then add one or more target points to check visibility.
    • 🌍 Viewshed – Place an observer location to visualize areas that are visible or obstructed based on elevation and terrain.

    3️⃣ Adjust Parameters for Accuracy

    • ✅ Green = Visible areas | ❌ Red = Obstructed areas
    • Modify observer height, visibility distance, field of view, direction, and tilt for precise analysis.

    🚀 Pro Tips

    1️⃣ Use Line of Sight to determine if a landmark, building, or terrain feature is visible from a specific location. 2️⃣ Apply Viewshed Analysis to evaluate coverage areas for security, urban planning, or telecommunications networks.

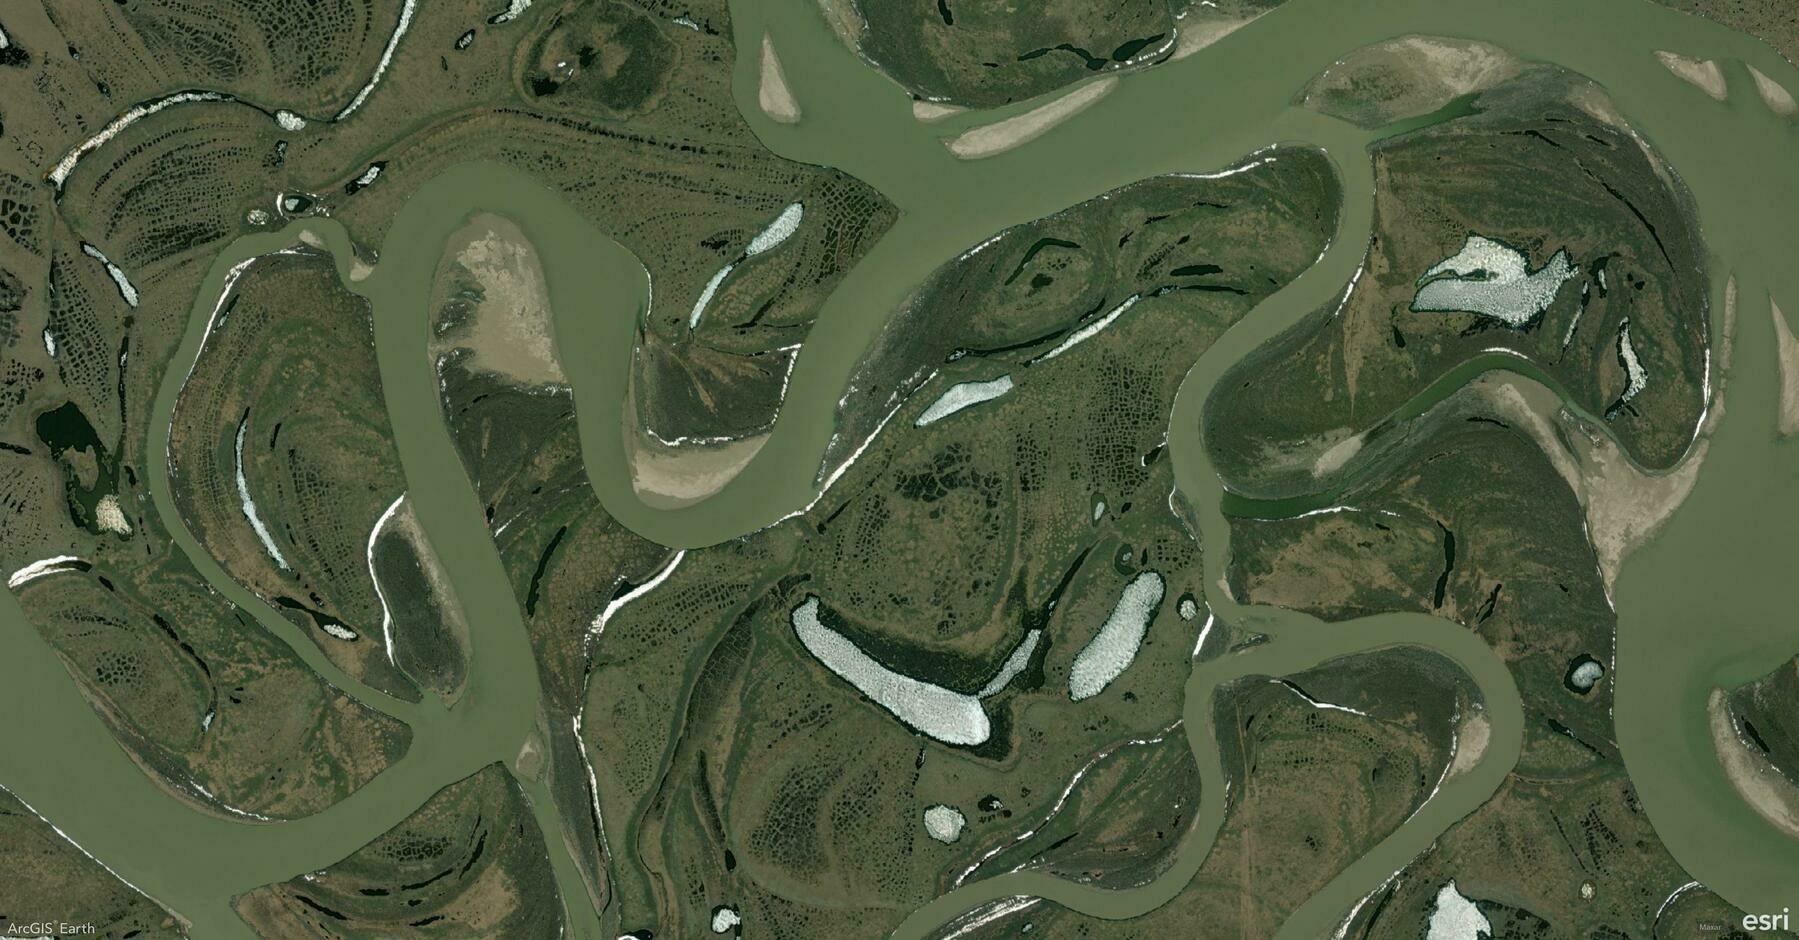
    Screenshot of Chaunsky District, Russia, from ArcGIS Earth
    → 9:40 PM, Mar 13
    Also on Bluesky
  • 🌍 #ArcGISEarth230Tips | Tip 36: Measure Distances & Areas in 3D on Mobile! 📏📲

    Did you know?

    With ArcGIS Earth Mobile, you can measure locations, distances, areas, and 3D distances in real time—perfect for quick field analysis!

    🛠️ How to Measure in ArcGIS Earth Mobile

    1️⃣ Open the Measure Tool & Select a Measurement Type

    • 📍 Measure Location – Get longitude, latitude, and elevation at a point.
    • 📏 Measure Distance – Measure the length of a path by adding points.
    • 📐 Measure Area – Calculate the surface area of a polygon.
    • 📊 Measure 3D Distance – Find the direct, vertical, and horizontal distances between two points.

    2️⃣ Perform a Measurement Move the crosshairs to a location and tap Add ➕ to place points. You can also Undo to remove the last point or Complete to finish.

    3️⃣ Save & Copy Results Tap Copy 📋 to store the result for future use.

    🚀 Pro Tips

    🏗️ Use 3D Distance to analyze height differences between terrain, buildings, or infrastructure.

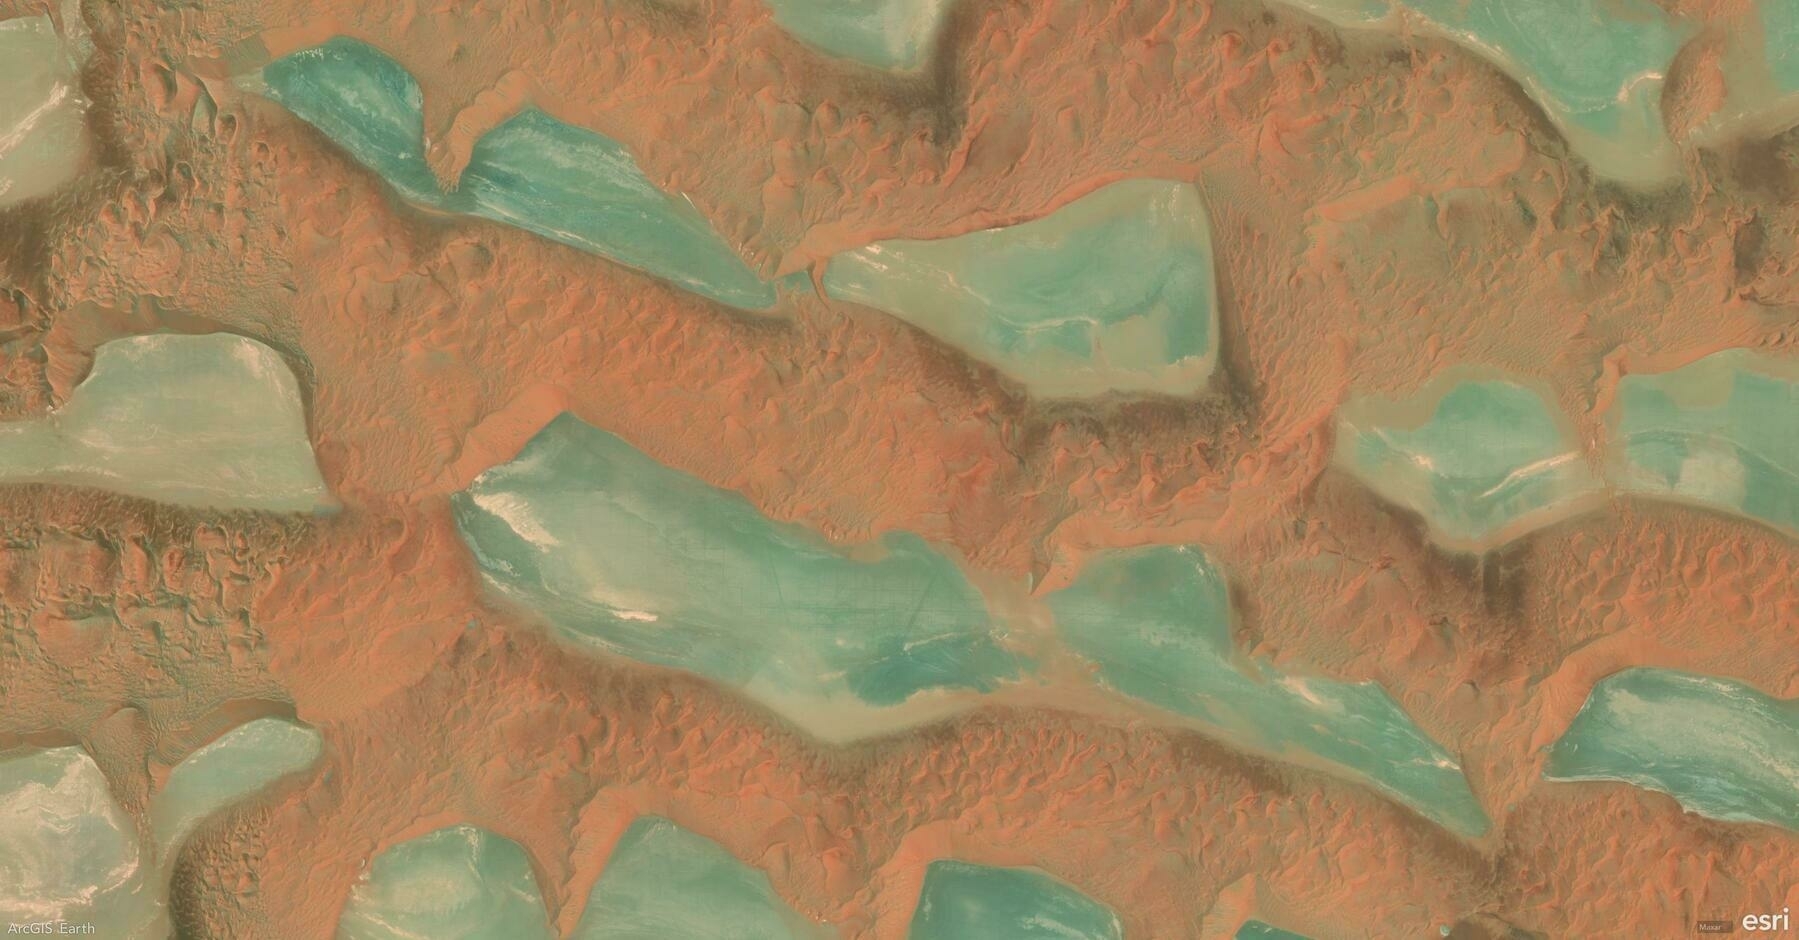
    Screenshot of Al Ahsa, Saudi Arabia, from ArcGIS Earth
    → 8:58 PM, Mar 12
    Also on Bluesky
  • 🌍 #ArcGISEarth230Tips | Tip 35: Create & Share Drawings on Mobile! ✏️📲

    Did you know?

    With ArcGIS Earth Mobile, you can draw, edit, and share geospatial features—including points, lines, and polygons—to enhance your spatial data collection and visualization. Whether marking key locations, sketching routes, or defining areas of interest, the drawing tools provide a simple yet powerful way to capture geospatial insights on the go!

    🛠️ How to Create & Edit Drawings in ArcGIS Earth Mobile

    1️⃣ Open Drawing Tools & Choose a Drawing Type

    • Tap the Toolbox 🧰 on the home screen, then select the Draw ✏️ tool (default: Point).
    • Choose from the following:
      • 📍 Point – Mark a specific location.
      • 📏 Line – Draw paths, routes, or boundaries.
      • 📐 Polygon – Define areas with multiple vertices.

    2️⃣ Enhanced Editing & Interaction

    • Tap a drawing to open a pop-up menu for editing attributes, adjusting styles, or deleting features.
    • Modify Shapes – Drag to adjust the position or reshape a feature.
    • Navigation Integration – Tap Navigate to open a third-party navigation app (e.g., ArcGIS Navigator, Google Maps, Apple Maps) for directions to your drawing.

    3️⃣ Sharing & Exporting Drawings

    • Manage Drawings – View all drawings in the Drawings tab in the Table of Contents.
    • Control Visibility – Show/hide individual drawings for a clutter-free map.
    • Save & Share as KMZ
      • 📂 Save as a Local KMZ File – Export selected drawings into a .kmz file.
      • ☁️ Share Across Devices – Upload to ArcGIS Online or ArcGIS Enterprise for continued editing on desktop.

    🚀 Pro Tips

    1️⃣ Use GPS 📍 to place points precisely at your current location. 2️⃣ Long-press a drawing for quick options like edit, delete, or share. ✨

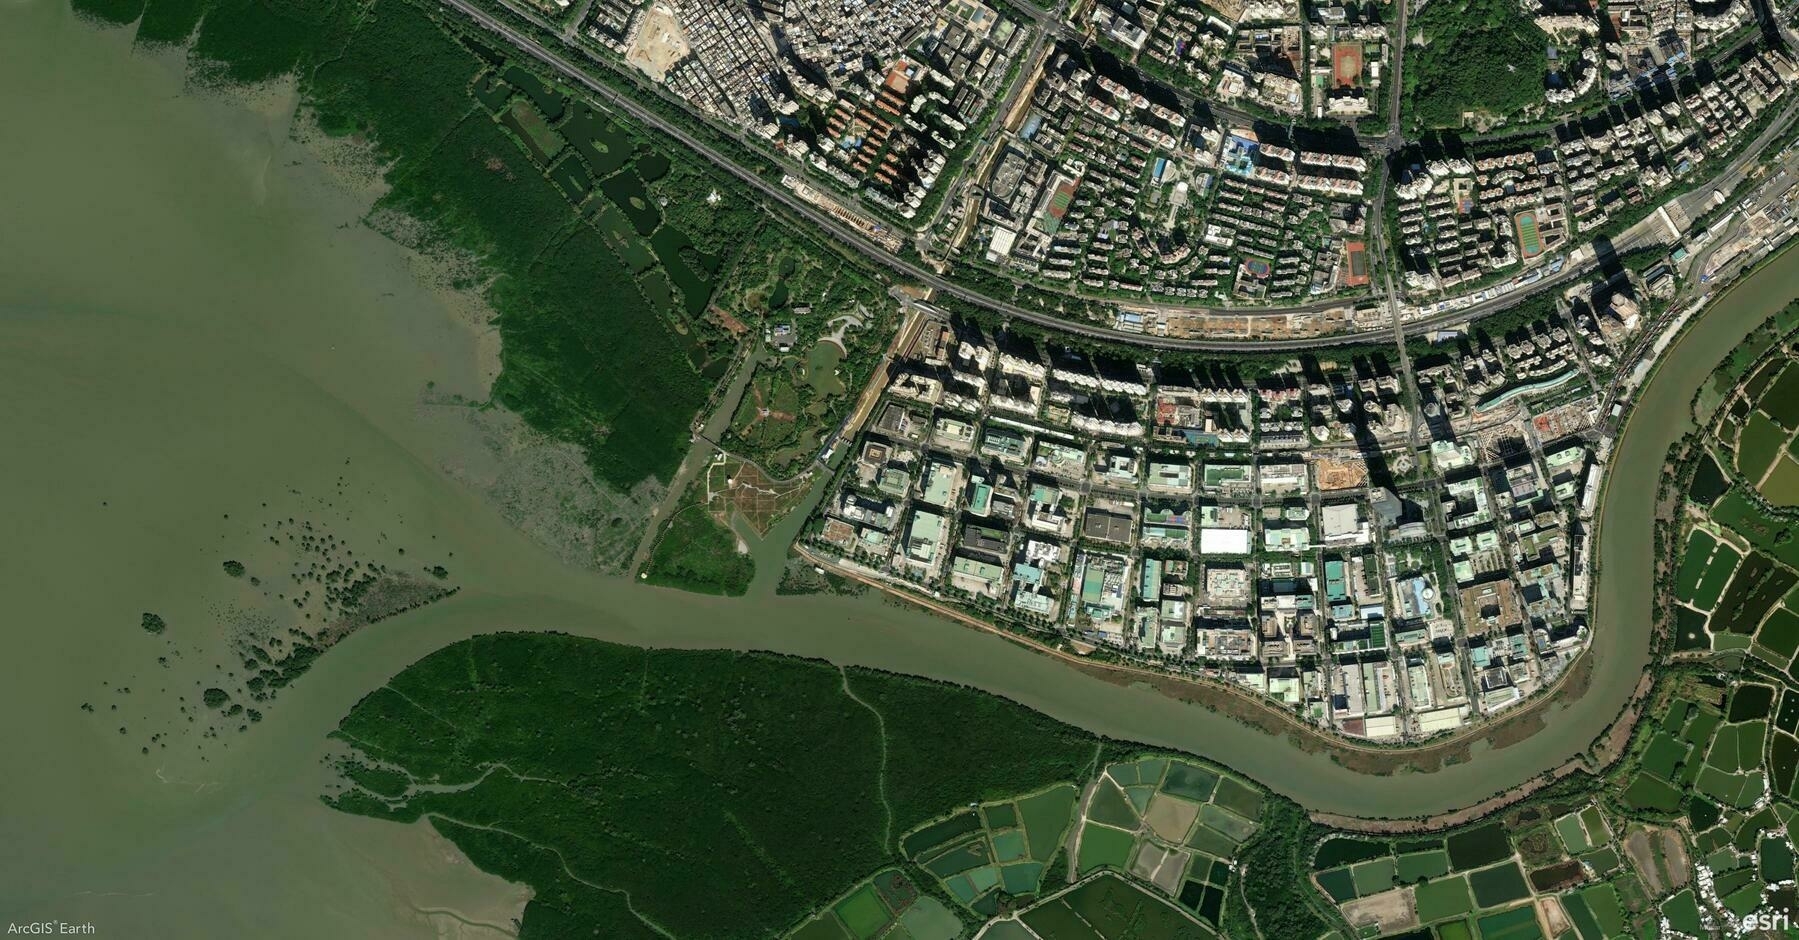
    Screenshot of Shenzhen Shi, China, from ArcGIS Earth
    → 9:30 PM, Mar 11
    Also on Bluesky
  • 🌍 #ArcGISEarth230Tips | Tip 34: Seamlessly Browse 2D & 3D Content on the Go! 🌍📲

    Did you know?

    Exploring spatial data has never been easier! With ArcGIS Earth Mobile, you can seamlessly browse 2D and 3D content, whether you’re online or working offline.

    🛠️ How to Add Data in ArcGIS Earth Mobile:

    1️⃣ There are four easy ways to add data in ArcGIS Earth Mobile:

    • Enter a URL – Add services like KML, Map, Image, Feature, or Scene Services by entering a web link.
    • Access ArcGIS Online or ArcGIS Enterprise – Browse and add organization-wide content.
    • Load Local Files – Import KML, GeoPackage, Mobile Scene Packages, Raster, and 3D models directly from your device.
    • Scan a QR Code – Quickly add data by scanning a QR code—no typing required!

    2️⃣ Enhanced Viewing & Interaction:

    • Toggle visibility – Tap the View button to show or hide layers.
    • Quick Actions – Long-press a layer to Share or Delete.
    • Identify Features – Tap a feature to view its attributes in a pop-up.

    🚀 Pro Tips

    1️⃣ Use touch gestures to zoom, pan, tilt, and rotate your 3D content for a fully immersive experience. ✨ 2️⃣ Try AR Mode – Long-press a layer to visualize data in Augmented Reality mode. 📡

    Screenshot of Los Andes, Argentina, from ArcGIS Earth
    → 9:45 PM, Mar 10
    Also on Bluesky
  • 🌍 #ArcGISEarth230Tips | Tip 33: Boost Efficiency with Quick Dock Customization ⚙️🚀

    Did you know?

    ArcGIS Earth’s Quick Dock feature lets you personalize your workspace by adding, reordering, and managing frequently used tools—streamlining your workflow for faster access to key functionalities. Whether you’re navigating, analyzing, or editing, customizing the Quick Dock ensures your most-used tools are always at your fingertips.

    🛠️ How to Use Quick Dock in ArcGIS Earth:

    1️⃣ Open Quick Dock Customization 🎛️ Go to Settings > Customization to access the Quick Dock panel.

    2️⃣ Add & Arrange Tools 📌 Click a tool to add it to the Quick Dock. Drag and drop to reorder tools based on your workflow.

    3️⃣ Optimize for Efficiency ⚡ Remove unneeded tools or reset the Quick Dock to its default state.

    🚀 Pro Tips:

    1️⃣ Speed Up Your Workflow – Keep essential tools like Measure, Bookmarks, or Spatial Filters just one click away. 🚀

    Screenshot of Ouargla, Algeria, from ArcGIS Earth
    → 11:15 PM, Mar 7
    Also on Bluesky
  • 🌍 #ArcGISEarth230Tips | Tip 32: Focus Your Analysis with Spatial Filters 🎯🔍

    Did you know?

    ArcGIS Earth’s Spatial Filter allows you to include or exclude specific buildings, trees, 3D objects, and points within a designated area. Whether you’re analyzing urban infrastructure, vegetation impact, or site planning, this tool helps you focus on the most relevant features while eliminating visual clutter.

    🛠️ How to Use Spatial Filters in ArcGIS Earth:

    1️⃣ Activate the Spatial Filter 🎛️ Right-click a 3D object or point scene layer in the Table of Contents and select “Spatial Filter”.

    2️⃣ Define Your Area of Interest 📌 Draw one or more polygons to include or exclude features, or manually select individual features to isolate or remove them from the view.

    3️⃣ Apply and Refine Your View 🔲 Choose Exclude to hide features inside the selection or Include to display only the selected features.

    🚀 Pro Tips:

    1️⃣ Improve Data Accuracy – Use spatial filters to hide outdated data and replace it with updated information. 📍 2️⃣ Apply multiple spatial filters for a focused, clear, and efficient analysis. 🔍

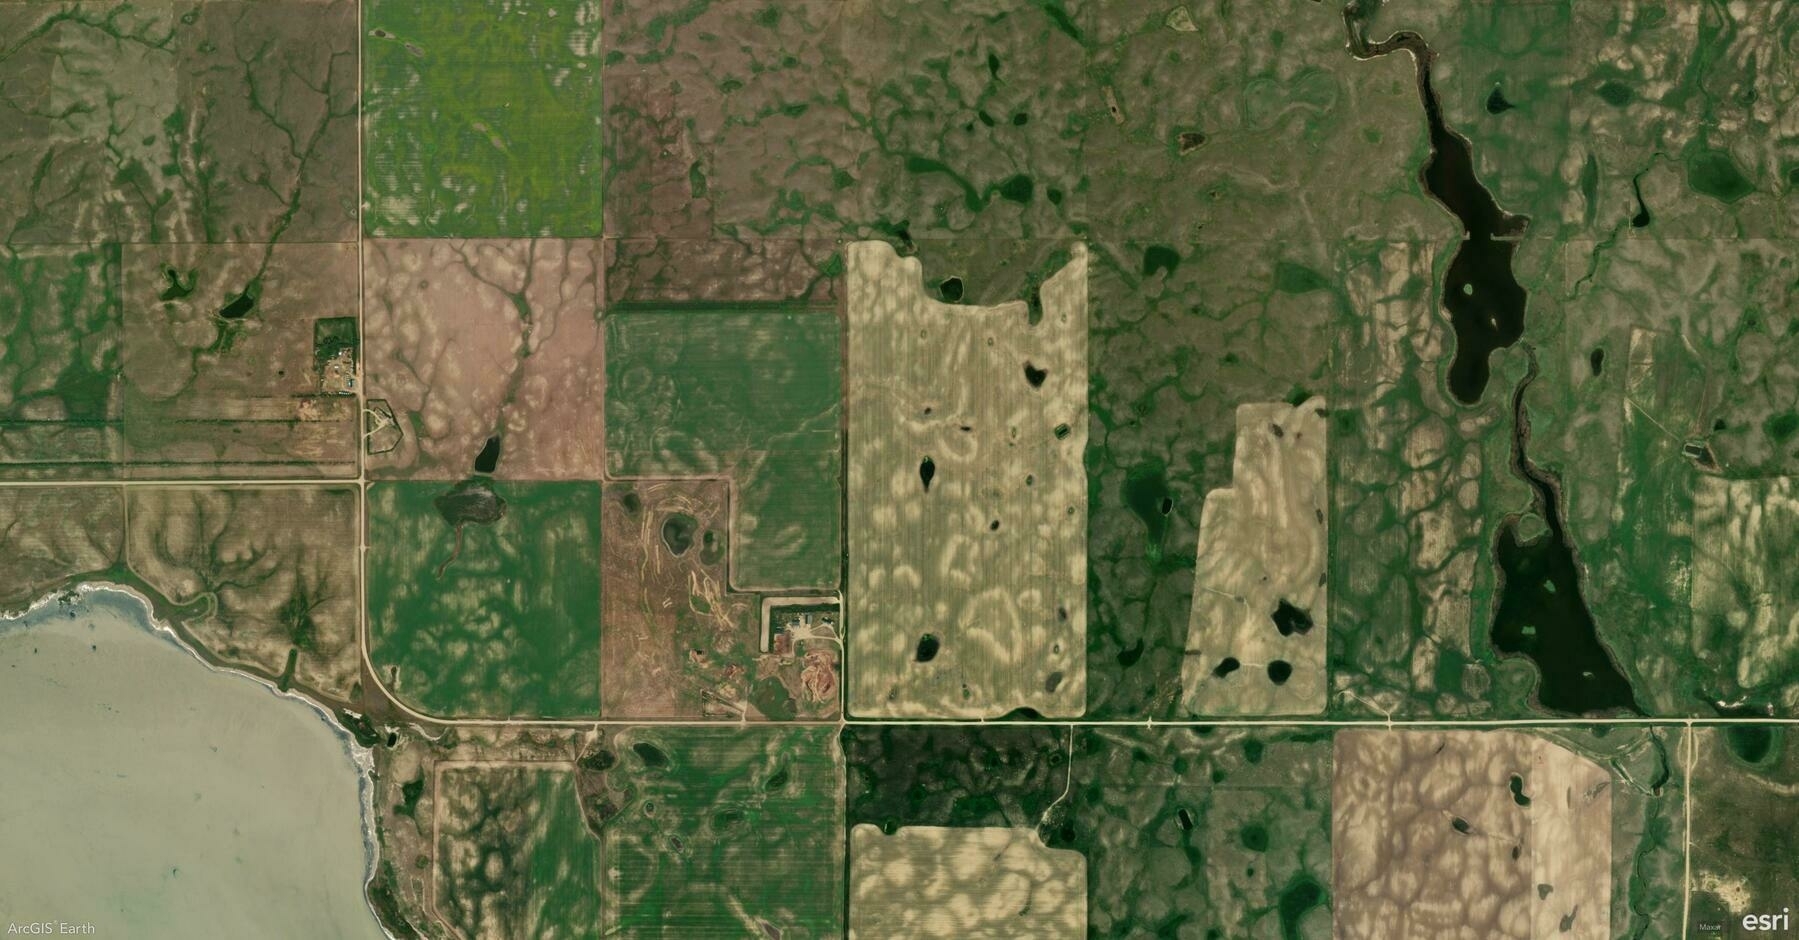
    Screenshot of Minton, Canada, from ArcGIS Earth
    → 9:44 PM, Mar 6
    Also on Bluesky
  • 🌍 #ArcGISEarth230Tips | Tip 31: Effortless 3D Navigation with SpaceMouse 🖱️🚀

    Did you know?

    ArcGIS Earth now supports 3DConnexion SpaceMouse, offering an intuitive, smooth, and immersive way to navigate 3D environments. With 6-Degrees-of-Freedom (6DoF) control, you can effortlessly pan, tilt, zoom, rotate, and fly through your data—perfect for detailed terrain exploration, city modeling, and underground navigation.

    🛠️ How to Use SpaceMouse in ArcGIS Earth:

    1️⃣ Enable SpaceMouse Navigation 🛠️ Go to Settings > Navigation and toggle Enable Space Mouse to activate support.

    2️⃣ Seamlessly Navigate in 3D 🌍 Experience real-time, fluid movement with precise control for exploring terrain, buildings, and subsurface data.

    3️⃣ Customize Controls for Your Workflow ⚙️ Adjust navigation speed and sensitivity for high-precision mapping or smooth overviews.

    🚀 Pro Tips:

    1️⃣ Fly Through Your Data – Effortlessly glide through terrain, buildings, and 3D models for in-depth analysis. 🏙️

    Screenshot of Northeastern Region, Iceland, from ArcGIS Earth
    → 10:15 PM, Mar 5
    Also on Bluesky
  • 🌍 #ArcGISEarth230Tips | Tip 30: Instantly Retrieve Location Details with "What's Here" 📍🔍

    Did you know?

    With ArcGIS Earth’s “What’s Here” tool, you can instantly identify addresses, coordinates, and place names anywhere on the globe—just by right-clicking! Whether you’re planning routes, verifying locations, or working offline, this tool delivers real-time insights without needing external apps.

    🛠️ How to Use “What’s Here” in ArcGIS Earth:

    1️⃣ Find Any Location 📌 Right-click anywhere on the globe and select “What’s Here” from the menu.

    2️⃣ Get Location Insights 🏠 Instantly retrieve addresses, coordinates, and place names for easy reference and analysis.

    3️⃣ Work Offline with Locators 🌍 Use reverse geocoding even offline with your own locators included in mobile map and scene packages.

    🚀 Pro Tips:

    1️⃣ Copy & Share Location Data – Quickly copy coordinates and addresses for reports, routing, or collaboration. ✂️ 2️⃣ Save Key Locations – Right-click and save as a KML point for future reference or integration with other GIS tools. 📍

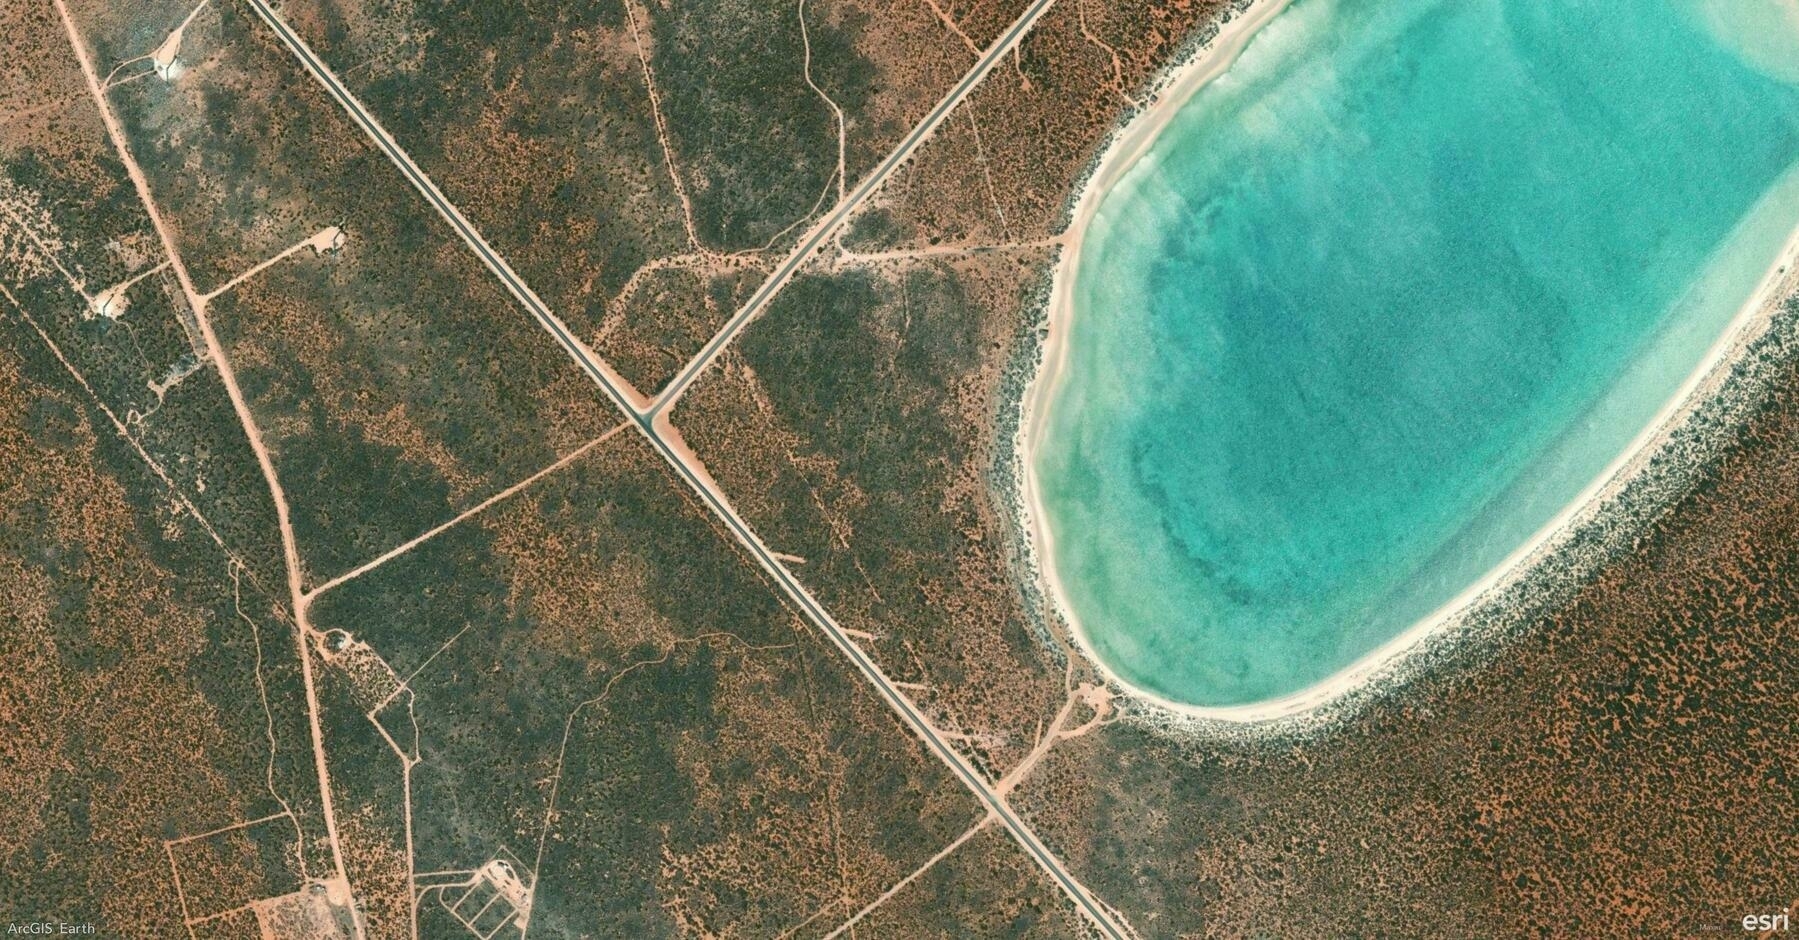
    Screenshot of Denham, Australia, from ArcGIS Earth
    → 9:06 PM, Mar 4
    Also on Bluesky
  • 🌍 #ArcGISEarth230Tips | Tip 29: Maximize Survey123 Integration in ArcGIS Earth 📊📍

    Did you know?

    ArcGIS Earth now seamlessly integrates with Survey123, enabling you to collect, review, and analyze survey data within a 3D environment. Whether you’re a field worker gathering real-time data or a stakeholder conducting QA/QC, this integration enhances accuracy, efficiency, and spatial insights.

    🛠️ How to Use Survey123 in ArcGIS Earth:

    1️⃣ Add a Survey Form ➕ Browse surveys from your organization or ArcGIS Online, then search and add a Survey123 form to the globe.

    2️⃣ Submit or Edit Records ✍️ Right-click a Survey123 form in the Table of Contents to submit a new record or update existing ones.

    3️⃣ Streamline Data Entry 🔄 Auto-populate surveys by selecting a feature—ArcGIS Earth dynamically transfers both attributes and geometry into the form.

    4️⃣ Enhance Decision-Making 🎯 Embed Surveys for QA/QC: Visualize, review, and update incoming records while analyzing data in 3D.

    🚀 Pro Tips:

    1️⃣ Customize Visualization – Adjust symbology and labels to highlight key insights. 🎨 2️⃣ Modify Geometry – Click Set Location in the survey window to update a record’s spatial position directly in ArcGIS Earth.

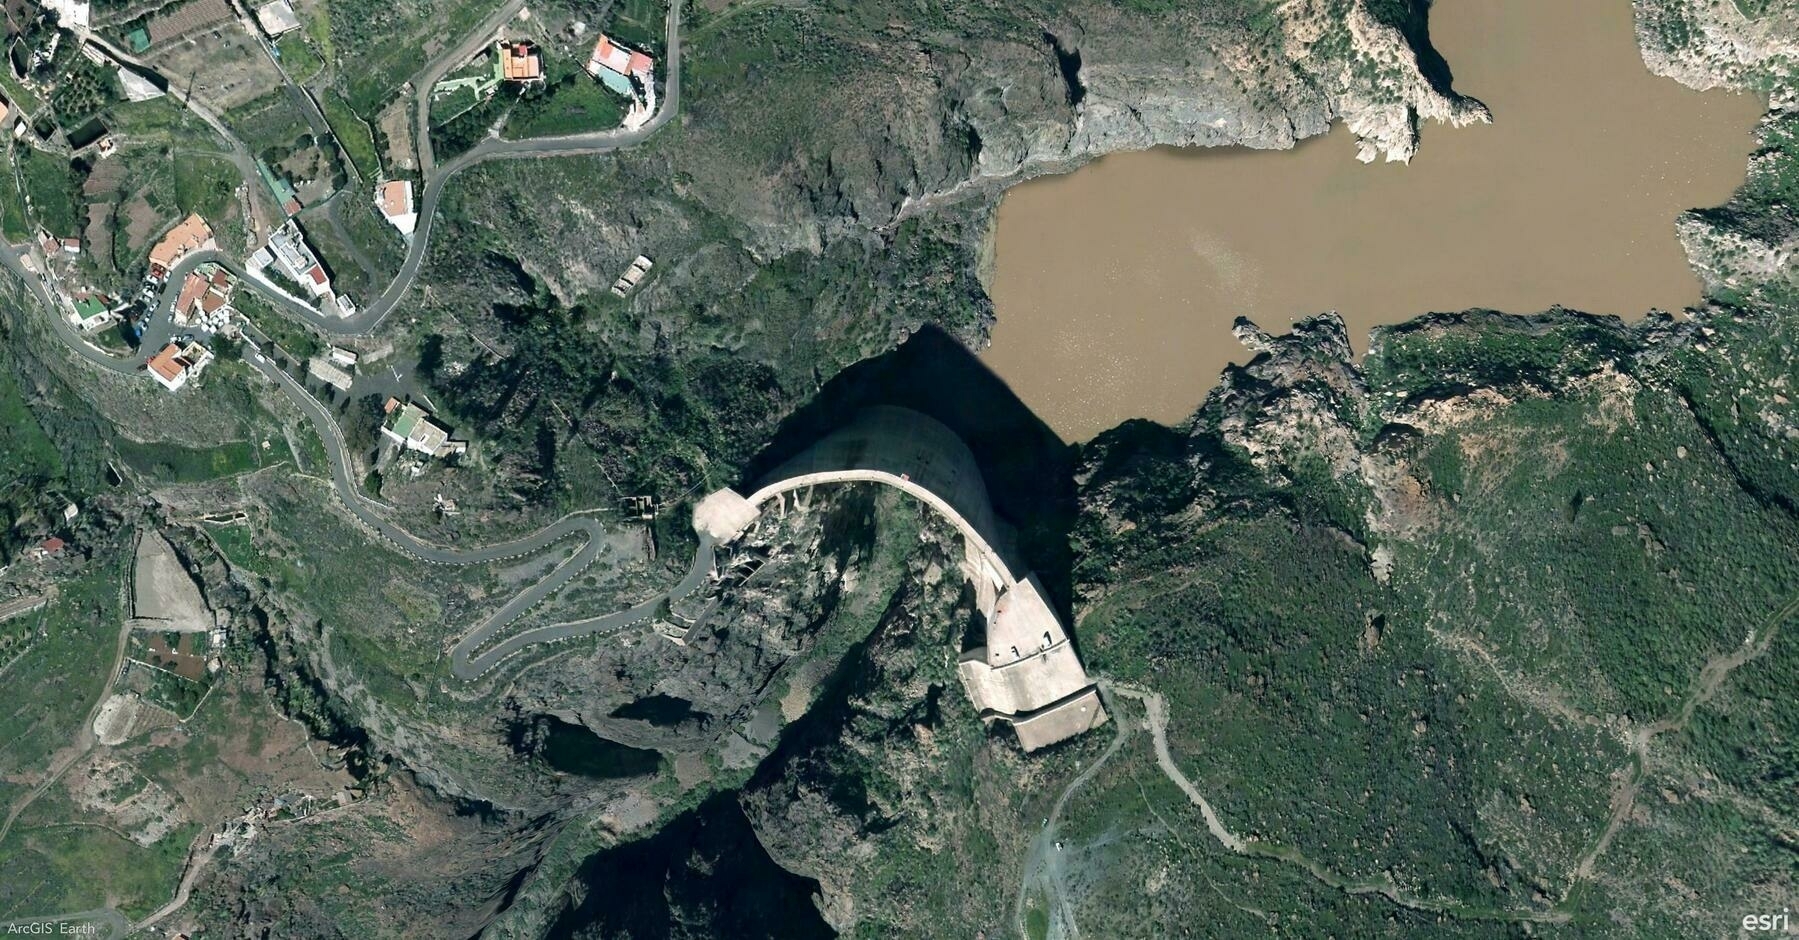
    Screenshot of Mogán, Spain, from ArcGIS Earth
    → 8:21 PM, Mar 3
    Also on Bluesky
  • 🌍 #ArcGISEarth230Tips | Tip 28: Visualize Changes Over Time with Time-Enabled Data Animation ⏳📊

    Did you know?

    ArcGIS Earth provides powerful time-based animation tools that allow you to track changes in spatial data over time. Whether analyzing climate change, infrastructure development, or disaster progression, the time slider and playback controls help bring your data to life with smooth, intuitive animations.

    🛠️ How to Use Time-Enabled Data Animation in ArcGIS Earth:

    1️⃣ Load and Activate Time-Enabled Data ⏳ Add KML/KMZ files, feature services, or image services that contain time attributes. The time slider appears automatically at the bottom of the screen and dynamically adjusts based on active layers.

    2️⃣ Control and Navigate Temporal Data 🎛️ Drag the time slider or select specific dates to set the start and end time. Click Play to animate the dataset and use Next/Previous buttons to step through time intervals.

    3️⃣ Customize Playback for Better Analysis 🎥 Fine-tune playback by setting it to repeat, reverse, or stop after a full cycle. Adjust animation speed for faster or slower transitions. Switch between UTC and local time for accurate time zone adjustments.

    🚀 Pro Tips:

    1️⃣ Analyze Multi-Layer Time Series – Overlay multiple time-enabled datasets (e.g., wildfire spread and population density) to observe interactions over time. 2️⃣ Optimize Performance – Enable only relevant KML nodes to ensure smooth animations without unnecessary visual clutter. 3️⃣ Refine Time Ranges – Adjust time intervals to highlight key events and make trends more apparent.

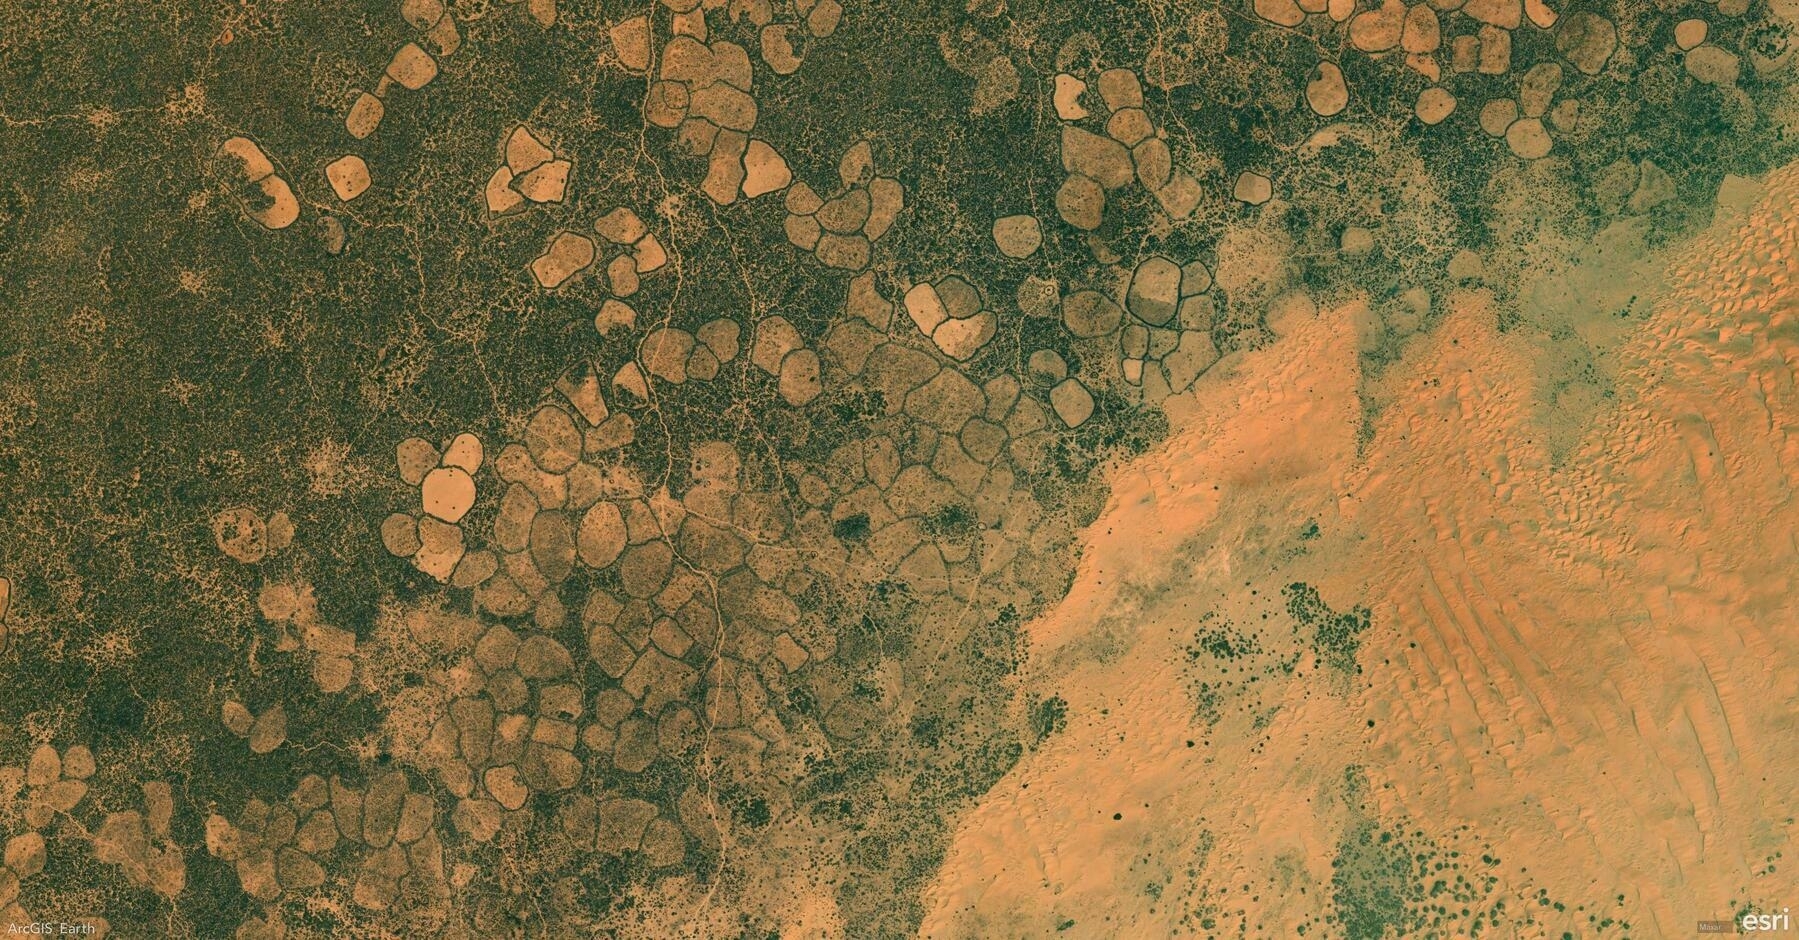
    Screenshot of Ceel Dheer, Somalia, from ArcGIS Earth
    → 8:45 PM, Feb 28
    Also on Bluesky
  • 🌍 #ArcGISEarth230Tips | Tip 27: Organize and Interpret Data with the Table of Contents & Legends 📑🗺️

    Did you know?

    ArcGIS Earth’s Table of Contents (TOC) and Legends provide an intuitive way to manage layers, control visibility, and interpret symbology. The TOC helps you organize, reorder, and customize layers, while the Legend panel offers a clear reference for symbol meanings, improving data interpretation.

    🛠️ How to Use the Table of Contents and Legends in ArcGIS Earth:

    1️⃣ Manage Layers Efficiently in the TOC 📂 The TOC serves as a control center for managing layers, allowing you to toggle visibility, adjust transparency, reorder layers, and group related datasets for better organization.

    2️⃣ Customize and Control Layers ⚙️ Right-clicking a layer or folder provides additional options, such as renaming, refreshing, removing, adjusting symbology, viewing properties, and exporting layers as KMZ files for sharing.

    3️⃣ Interpret Data Easily with Legends 📜 The Legend Panel updates dynamically based on active layers, making it easier to understand map symbology. This is especially useful for land use classifications, hazard zones, and transportation networks, where colors and symbols differentiate categories.

    🚀 Pro Tips:

    1️⃣ Use the Search in TOC to quickly locate layers by keyword. 2️⃣ Group Layers for Organization – Keep related layers in folders to maintain a structured, clutter-free TOC. 3️⃣ Optimize Legends for Presentations – Hide non-essential layers to focus on key map elements.

    Screenshot of Barcelona, Spain, from ArcGIS Earth
    → 10:20 PM, Feb 27
    Also on Bluesky
  • 🌍 #ArcGISEarth230Tips | Tip 26: Improve Map Readability with Labels in ArcGIS Earth 🏷️🗺️

    Did you know?

    ArcGIS Earth allows you to add and customize labels to improve map clarity and interpretation. Whether you’re labeling cities, infrastructure, or geographic features, using clear, well-styled labels enhances your spatial analysis and presentation.

    🛠️ How to Apply and Customize Labels in ArcGIS Earth:

    1️⃣ Enable Labels for Your Data 📍🔤 Right-click a supported layer in the Table of Contents, select Labeling, and click Enable Labeling to turn on visibility. KML users can now label lines and polygons with a simple toggle switch in the Layer Properties window.

    2️⃣ Configure Label Properties for Clarity 🎛️ In the Labeling Properties window, choose which attribute field to display, control placement relative to features, and prioritize key labels for better readability.

    3️⃣ Customize Label Appearance for Better Readability 🎨 Adjust font, size, color, halo, and background transparency to ensure labels clear over different basemaps and terrain.

    🚀 Pro Tips:

    1️⃣ Label KML Lines & Polygons Easily – No more workarounds! Just use the Label toggle switch in Layer Properties to turn KML labels on/off. 2️⃣ Enhance Readability – Apply halo effects and backgrounds to make labels stand out over complex maps.

    Screenshot of Grantsville, United States, from ArcGIS Earth
    → 9:24 PM, Feb 26
    Also on Bluesky
  • 🌍 #ArcGISEarth230Tips | Tip 25: Unlock the Power of Symbology in ArcGIS Earth 🎨🗺️

    Did you know?

    ArcGIS Earth provides powerful symbology tools for clearer spatial analysis and data visualization. Whether tracking public health trends, environmental changes, or demographic data, choosing the right symbology enhances insights and decision-making—in both 2D and 3D.

    🛠️ How to Apply Symbology in ArcGIS Earth:

    1️⃣ Choose the Right Symbology 🎛️ Right-click a feature layer, select Symbology, and pick the method that best represents your data:

    • Single Symbol (Location) – Apply a uniform symbol to show distribution.
    • Unique Symbol (Type) – Differentiate features based on attribute values (e.g., land use types).
    • Graduated Colors (Counts & Amounts) – Use a color ramp to represent quantitative variations (e.g., population density).
    • Dictionary Symbology – Apply standardized symbols like MIL-STD-2525 and NATO APP-6 for defense and emergency response.

    2️⃣ Customize Symbols for Enhanced Visualization 🎨 Modify color, transparency, classification, and stroke properties to refine your map’s clarity. Adjust symbol size and style to highlight key insights.

    3️⃣ Use 3D Symbol Extrusion for Deeper Analysis 📊 Extrude points, lines, or polygons to represent numerical attributes in 3D, making spatial relationships more apparent. This technique is ideal for tracking pandemic cases, visualizing urban expansion, or modeling elevation changes.

    🚀 Pro Tips:

    1️⃣ Track Changes Over Time – Use graduated colors and 3D extrusion to visualize trends such as COVID-19 spread, pollution levels, or deforestation rates. 2️⃣ Standardize Symbology for Interoperability – Use Dictionary Symbology to ensure consistent representation across defense, emergency response, and security operations. 3️⃣ Create Custom Symbology – Import mobile style files (.stylx) to define unique symbology styles that fit your organization’s needs.

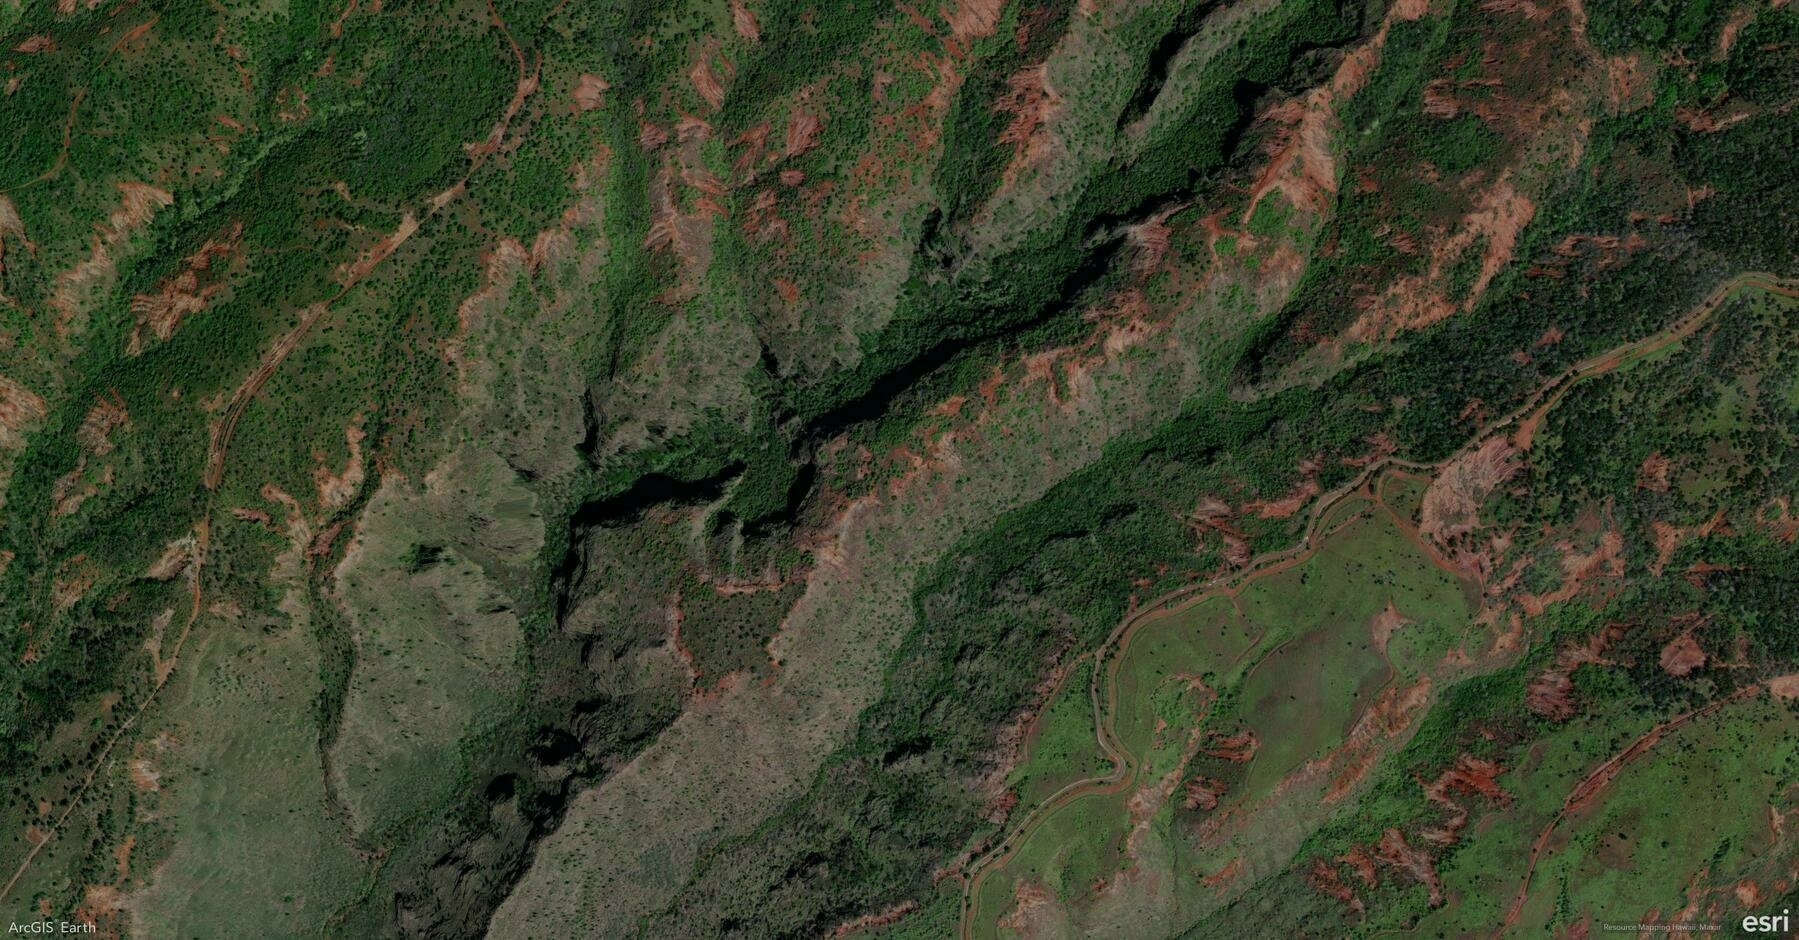
    Screenshot of Kekaha, United States, from ArcGIS Earth
    → 9:04 PM, Feb 25
    Also on Bluesky
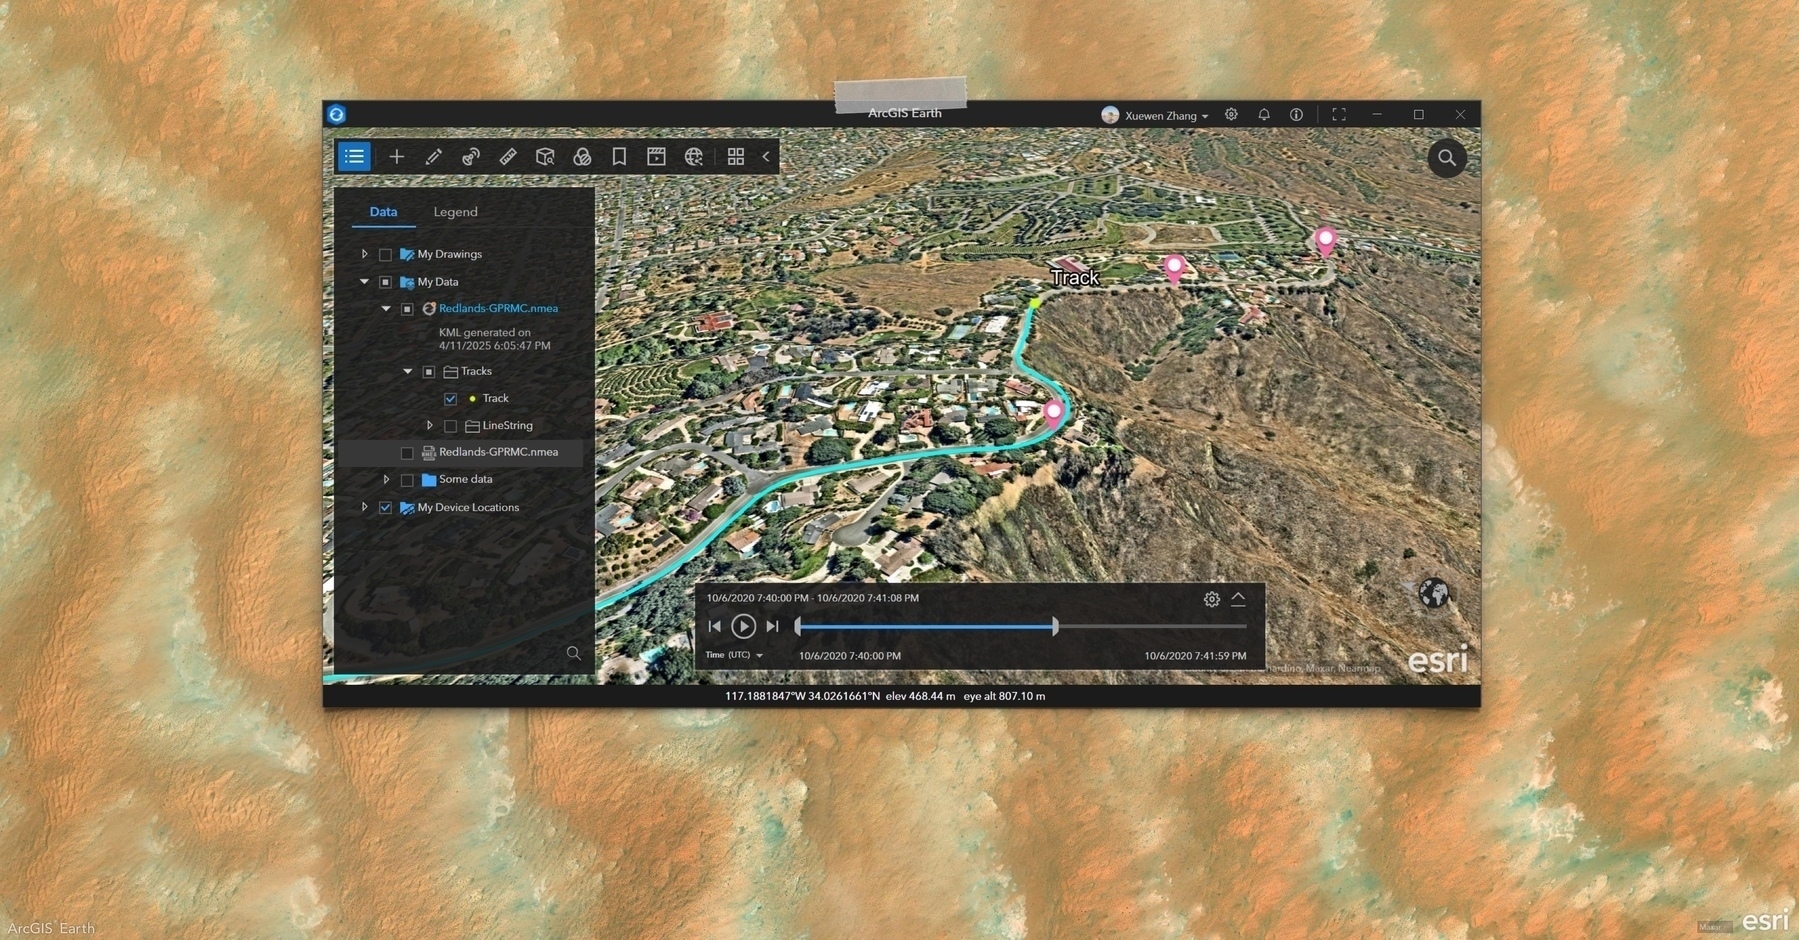
  • 🌍 #ArcGISEarth230Tips | Tip 24: Boost Efficiency with ArcGIS Earth Administrator Configuration ⚙️🔧

    Did you know?

    ArcGIS Earth allows administrators to customize and share configuration settings, providing users with a predefined GIS environment that eliminates manual setup. By modifying the config.xml file, admins can preset portal connections, basemaps, GIS services, authentication settings, and UI preferences, reducing setup time and enhancing workflow efficiency across teams.

    🛠️ How to Configure and Deploy Custom Settings in ArcGIS Earth:

    1️⃣ Customize Configuration Files for a Tailored Experience 🛠️📂 Edit the config.xml file (located in C:\Program Files\ArcGIS\Earth\bin\config.xml) to: ✔️ Preload ArcGIS Online and ArcGIS Enterprise portals. ✔️ Set startup layers, basemaps, and elevation services for consistency. ✔️ Customize startup behavior, UI preferences, and security settings to align with organizational needs.

    2️⃣ Share Custom Configurations Across Your Organization 🔗📤 After modifying config.xml, deploy it across your organization by replacing the default configuration during installation. This ensures users can immediately access predefined services, layers, and settings without additional setup.

    3️⃣ Optimize the User Experience for Faster Adoption 🚀📊 By providing a preconfigured ArcGIS Earth environment, administrators help users focus on GIS tasks rather than setup, flattening the learning curve and streamlining workflows.

    🚀 Pro Tips:

    1️⃣ Standardize Portal Access – Preload ArcGIS Online & Enterprise connections to ensure seamless integration. 2️⃣ Preconfigure Workspaces – Define basemaps, layers, and datasets to maintain organizational consistency. 3️⃣ Customize UI Elements – Modify banner messages, feedback links, and acknowledgment text to align with your organization’s branding.
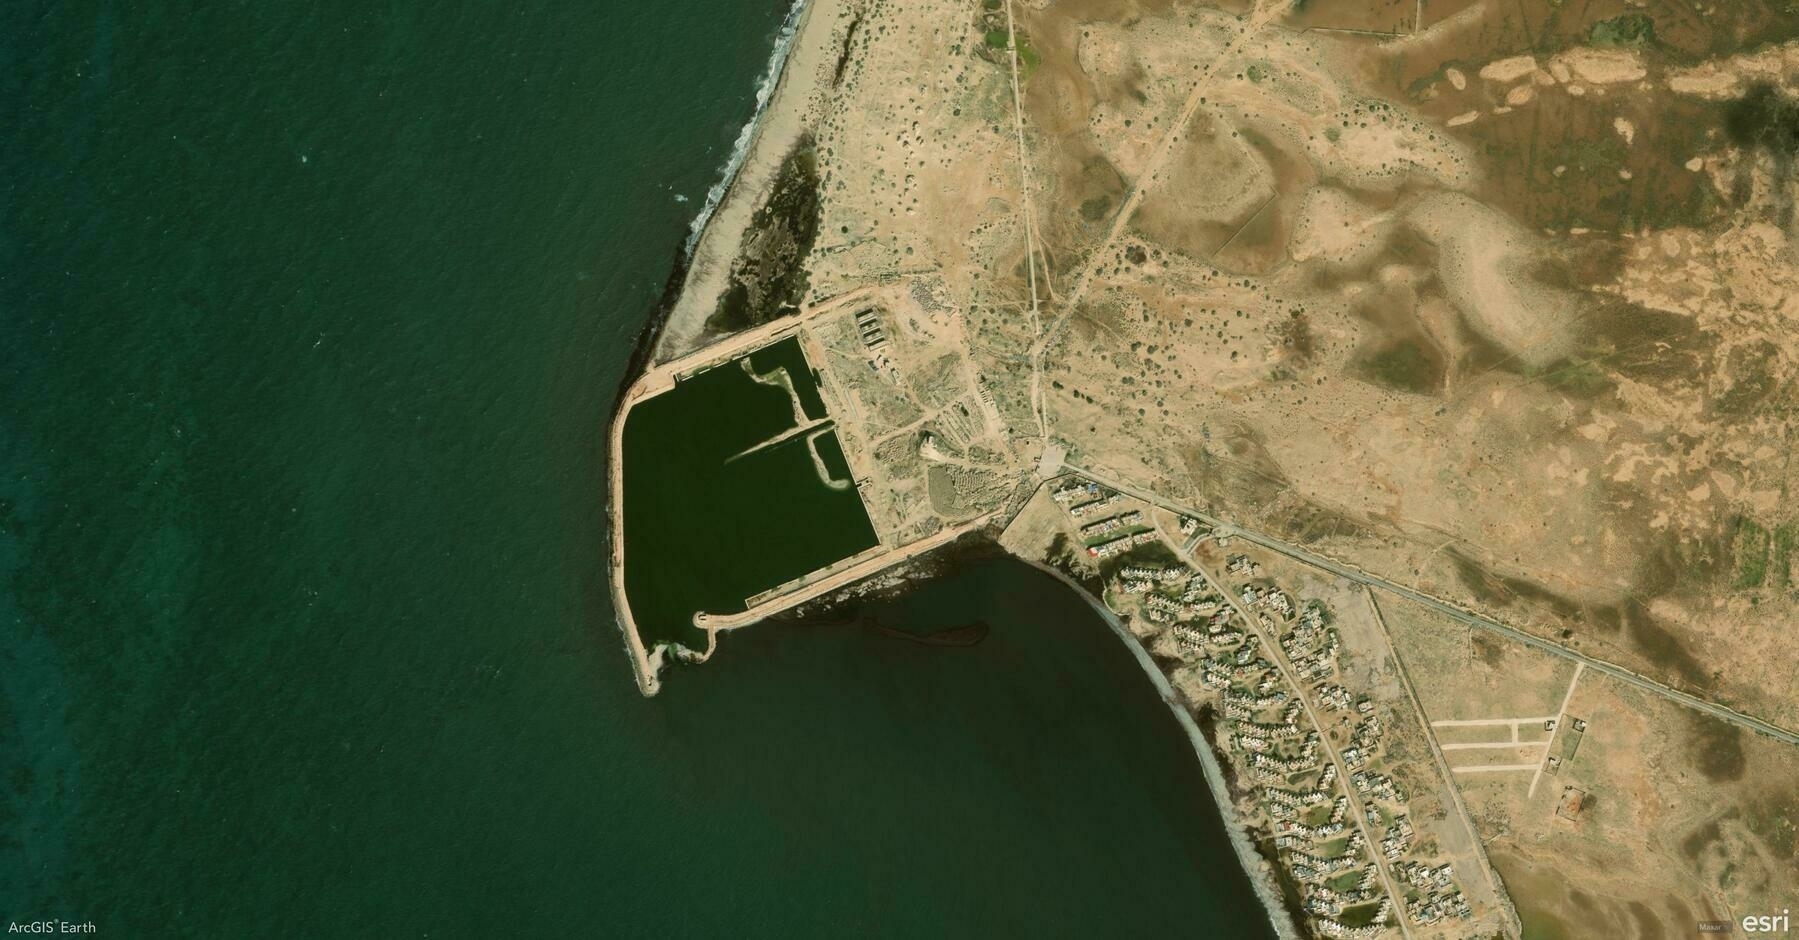
    Screenshot of Libya, from ArcGIS Earth
    → 9:09 PM, Feb 24
    Also on Bluesky
Page 1 of 2 Older Posts →
  • RSS
  • JSON Feed
  • Lucky
  • Archive
  • About